
Markets & Investing
Alternative Investment Market 2018: The Private Equity ‘Golden Year’
12 Apr 2019

eFront, the financial software and solutions provider dedicated to Alternative Investments, has published its latest Quarterly Private Equity Performance report, showing that private equity funds globally have continued their strong showing of recent years, with performance stabilizing at levels close to the record set in 2017.
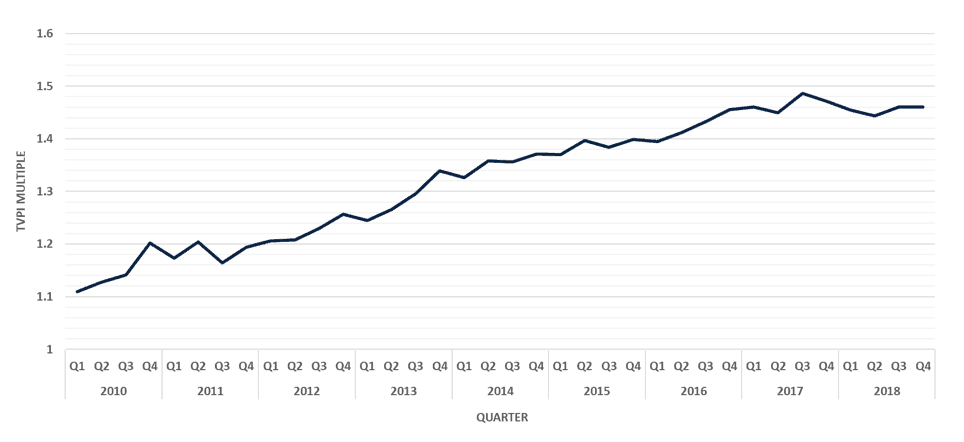
The report also shows that in 2018, global LBO performance stabilized at levels fairly close to the records set in 2017. Overall returns (TVPI) settled at 1.46x in the final quarter of 2018, showing a net excess performance of 0.037x when compared to the five-year average of 1.417x and 0.13x when compared to the ten-year average of 1.325x.
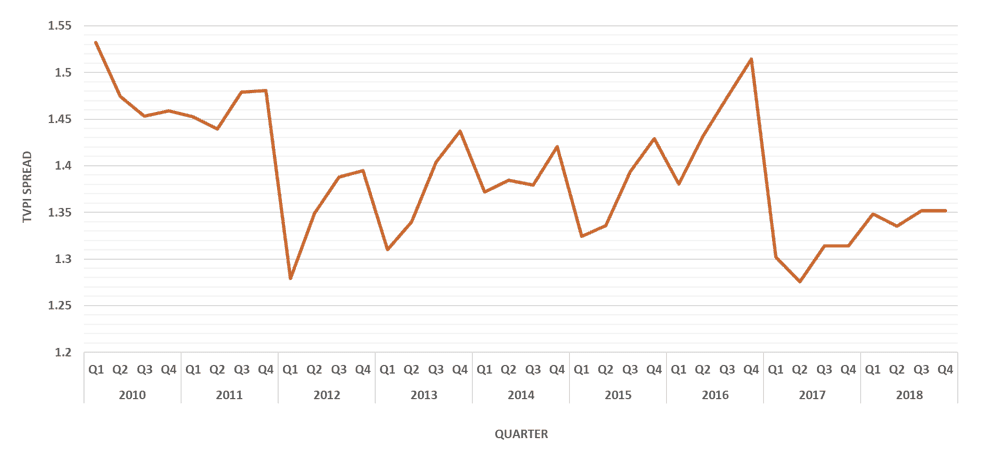
Investment risk, measured as the dispersion of performance between the top 5% and the bottom 5%, also saw a stabilization, at around 1.35x – below to the five-year average of 1.37x. Fund manager selection risk has therefore significantly decreased over time from a high of more than 1.5x in 2016. This peak and subsequent decline could be related to a variation in the pace and scale of distributions, magnifying the discrepancies of performance between fund managers.
Key findings:
- LBO fund performance stabilized in 2018 around the record levels from 2017
- Returns reached 1.46x in Q4 – a net excess performance of 0.13x when compared to the ten-year average of 1.325x
- Investment risk also stabilized, to around 1.35x, confirming a trend initiated in 2012 towards a lower level of risk
- Time-to-liquidity, meanwhile, saw a further sharp fall in 2018, reducing to 2.7 years – down from nearly 4 years seen at the last peak in 2015 and below the long-term average of 3.14 years
- For the US, 2011 and 2014 vintage year funds appear to perform well above average, with other vintages broadly in line
- For Europe, 2012 and 2014 are performing well, with the former reaching a TVPI of close to 2x
- Overall, active European LBO funds, with one exception, seem on track to outperform the historical average
Tarek Chouman, CEO of eFront, commented: “After a strong period of performance for private equity, 2019 appears to be a crossroads for the industry, either set to confirm the maturity of the industry and a “new normal” of high returns and lower risk, or signaling the beginning of a new down cycle. Though further progression remains possible, it is unlikely given the current late-cycle phase we are in.”
From a time-to-liquidity perspective, 2018 followed the same pattern witnessed since 2015: first a sharp increase in the liquidity during the first quarter followed by a gradual decrease during the next three. Overall, last year confirmed the downward trend observed since 2015, with time-to-liquidity reaching 2.7 years – well below the long-term average of 3.14 years.
Dividend recapitalizations might play a role in this significant reduction the time-to-liquidity, enabling fund managers to distribute early while retaining full control of the assets. Fund managers are capitalizing on the current high valuations to cash out and shield their performance from a potential abrupt end of the current cycle. However, this approach might not be sustainable in the long term, as time is required to healthily develop portfolio companies.
Chouman commented: “2019 will be an interesting year to follow in terms of time-to-liquidity, which is now at close to the threshold of 2.5 years, below which it seems difficult for fund managers to fully deploy their skillset to create value in portfolio companies. Debt remains cheap, thus supporting more dividend recaps, however, markets are volatile, and the leveraged loans market was at a standstill at the end of 2018. Moreover, company valuations might not increase as fast as they have done previously, and regulators now limit leverage to six times EBITDA, further inhibiting recaps.”
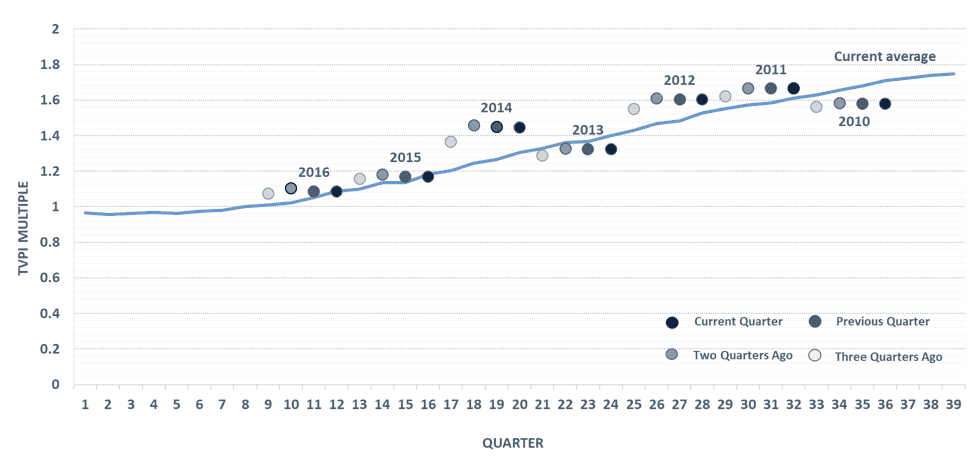
Returning to performance and looking at vintage years, globally, 2011 and 2012 continue to hover above the average, while 2014 shows strong performance. 2010 and 2013 appear to perform slightly below average (Figure 4). For US funds, 2011 and 2014 are the strongest performers, while in Europe 2012 and 2014 occupy that position. 2012 in Europe is confirming its very strong performance edging closer toward a 2.0x multiple. Overall, active European LBO funds, with one exception, seem on track to outperform the historical average.
Read More:


