
Crypto & Digital Assets, FX & Currencies
Explaining Bitcoin Charts
20 Oct 2014

The idea of a decentralized and unregulated crypto-currency which doesn’t have any political restrictions or limitations can be overly complicated at first. What Bitcoin does is compel people to change their perception about money and value transfer. Luckily enough, the Bitcoin community has been diligently able to perfectly consolidate informational data via a rather loose network of dedicated volunteers.
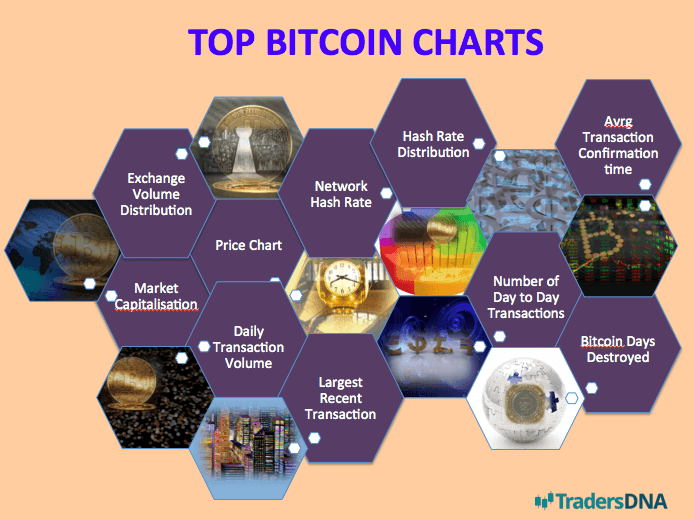
Mentioned below are some of the statistics mentioned on a Bitcoin chart, in no particular order. Although the list does not contain an explanation of particular statistics, like the mining and revenue operating margin, primarily due to the fact that these statistics concentrate more on a subset of the Bitcoin community.
Market Capitalization
Market capitalization on a Bitcoin chart shows the historical number of sum total of Bitcoins in the market which is then multiplied by the going exchange rate for that particular trading day in US dollars. You can think of it as a Bitcoin monetary base.
Price Chart
The price chart indicates the previous trade price for Bitcoin (BTC) as opposed to a variety of different currencies and ranks the exchange in accordance with a 30-day volume. You can also access advanced charting functions on the price chart. And the price depth indication of BTC/USD on the MTGox exchange is normally a good indicator of the total market price.
Exchange Volume Distribution
This Bitcoin chart is designed to indicate the trading volume distribution through the exchange as well as a number of different Bitcoin currency pairs.
Network Hash Rate
This chart displays the hashing complexity and the accumulated number of Giga hashes on a per second basis, which is considered the computation speed. The entire network is performing on for a series of different time windows. This is calculated by dividing the total target by the existing target where the target is a 256-bit number. The complexity of the computation is daunting and it shows how difficult it actually is to locate a new block in comparison to how easy it should and could be.
Difficulty changes every 2016 blocks or every two weeks, and to locate a block, the SHA-256 of a block’s header must at all times be less than or equal to the existing target in order for the block to be accessed and accepted by the Bitcoin network.
Hash Rate Distribution
This Bitcoin chart is a calculation of the hash rate distribution among the biggest of Bitcoin mining pool. It is imperative to track and estimate because the reliability of the entire network counts on a single factor which should not exceed 50% of the total hashing power. There is another more detailed option to do this, but requires the use of another data source and IP address that first relays the block. The data source is Block Origin.
Number of Day to Day Transactions
This chart is instrumental in finding out the overall number of exclusive Bitcoins which are traded on a daily basis. There is another version as well and the alternate version does not include the transactions with the 100 most popular Bitcoin addresses based on total results. And since the launch of Satoshi Dice, there has been a considerable rise in nominal transactions over the years.
Daily Transaction Volume
The daily transaction volume estimates the transactions and their volumes each day, in USD. An alternate source of measurement, which is in the form of graph monitors Bitcoin networks in real–time, including numerous other factors like block creation and the currency trade measured in BTC.
Bitcoin Days Destroyed
This chart applies a weekly average to the non-cumulative measurement. Bitcoin Days Destroyed for each transaction is measured by taking into account the total number of Bitcoins involved in a transaction, multiplying it by the total number of days it has been in transaction since those Bitcoins were last spent. Bitcoin Days Destroyed indicates a valid indication of the transactional volume transferred to the user and other account reorganizations due to the high value of days ‘destroyed’ and identifies less new Bitcoin and an increase of the old Bitcoin. You can consider it a tool for calculating monetary velocity.
Average Transaction Confirmation Time
The average transaction confirmation time is used to measure the ‘mean’ length of time a transaction takes for the block to accept. Reasonable estimations are based on the length of time and the approval of different transactions to be deemed as cleared or good. However, the risk level will be associated with the transaction’s total value. Another thing this chart shows is the fees paid for the transaction against those whose fees have not yet been paid.
Largest Recent Transactions
The largest recent transactions are gathered from the last 50,000 transactions. This list identifies an actual realization of the sizes of Bitcoin transactions which occur on the Bitcoin network.
So, these are some of the most important factors to consider when reviewing Bitcoin charts.
Related Posts:
Best Bitcoin Trading Platforms
How Bitcoin Prices Affect Exchange Volumes
What a Trader should know about Bitcoin


