
Trader Education
Explaining Volatility
05 Nov 2014

Volatility is the statistical calculation of the spreading of returns based on a specific market index or a particular security. You can measure volatility using two methods.
- (1) You can either calculate it through the standard deviation methods or
- (2) you can measure the differing factors between returns that are coming back from that specific security or a market index. So, the thing you have to look for is how low or high the volatility is. Higher market volatility adds considerable risk to a security.
Another definition of volatility can be that it is a factor in the formula for calculating option pricing which shows the limit to which the return of a primary asset will vary between the present and when that option is going to expire. Volatility in trading is always indicated as a percentage that coefficient within the various formulas for options pricing which depend on daily trading and the outcome of trading on a daily basis.
In Simpler Words
A simpler explanation of volatility can be that it is basically the amount of doubt or risk associated with how certain factors might influence a security’s price. If this risk or ‘volatility’ is high, then the chances that the security will effectively disperse towards the larger range of prices in the market. This increases the risk that the prices of that security will be subject to considerable and consistent fluctuation over a short-term in the market, irrespective of the direction.
Reduced volatility, on the other hand, signifies that the value of the security will not fluctuate considerable and will remain steady spread on a longer period of time. Another way traders measure the propensity of trade volatility is that they look at its ‘beta’. A ‘beta’ estimates the total volatility of a security’s return as opposed to the returns of an appropriate standard or level, for example most traders normally use the S&P 500.
Types of Volatility
There are numerous types of market volatilities and the first one that is considered is the real volatility of the stock itself. This can be identified through the use of historical charts and can be calculated over a given period of time but is usually evaluated in 10-day, 20-day and or 30-day stock evaluations. This data can include intraday readings as well, but normally is measured form a single day’s closing price to the next day’s closing price. You can also view this data in several indicators, for example the Average True Range Bollinger Bands.
There is another type of volatility known as implied volatility. You can think of this volatility as an ‘expected’ volatility which is spread across singular trading options. Implied volatility of a trading option is kept out of the price of that option. That is basically because of the fact all the factors are known beforehand, factors like strike, the price of the option, expiration of the option, interest rates, etc. All these are known except the volatility factor for that specific option when it is priced. This is done so that the value can be shunned out, allowing the trader to judge the option’s relative prices. Is a $5 call cost-effective or pricey? You can only tell if you look at the implied volatility of the options.
Consider this example: let’s assume a trader is trading his stock at $100 with the implied volatility of let’s suppose, 25%. Now, the options are suggesting the stock price could increase or decrease by 25% with a single standard deviation. So, one standard deviation could equal 68% if we talk about a nominal distribution. All in all, what this suggests is the fact there could be a chance the stock might likely be somewhere around $75 and $125.
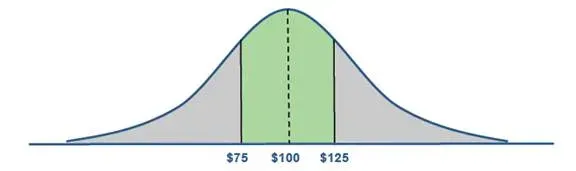
Source: Option Monsters
The Right Plan of Action
A majority of options traders emphasize solely on market volatility. And there has been a considerable amount of research that has been conducted under the practical notion that alterations in volatility can be predicted much more conveniently when you talk about essential asset values. When the implied volatility decreases, this is the time when traders come into action and attempt to buy an option(s). However, when the implied volatility increases, traders usually try to sell their options quickly or try and implement their trading strategies for long-term gains.
Traders who prefer directional trades normally use call or place spreads when the implied volatility of an option increases.


