
resources
How to Use an Options Expiration Payoff Analyzer to Assess Risk
12 Oct 2026

An options order ticket tells you what you’re buying or selling. A payoff diagram helps you see the risk those trades create together.
A trader might sell an uncovered call for premium without recognizing that losses can keep growing as the stock rises. Another might enter a spread’s premium as a credit instead of a debit and get a misleading result. Reviewing the diagram alongside the inputs can help catch both mistakes.
An options expiration payoff analyzer plots your profit or loss at expiration against the price of the underlying stock or index. It shows where you break even, where gains stop, and where losses are capped or remain open-ended.
The workflow below covers gathering inputs, building the diagram, reading its shape, and checking what it leaves out. The chart is a scenario tool, not a prediction or a trade recommendation.
Key Takeaways
- A payoff analyzer is not a forecast. It calculates expiration outcomes from the numbers you enter, not the likelihood of those outcomes.
- Payoff and profit are different. Payoff describes the option’s expiration value. Profit also accounts for the premium paid or received.
- Breakevens are where profit equals zero. For a long call, the expiration breakeven is the strike price plus the premium paid, before costs.
- Read the full price range. Flat segments show constant outcomes within a region. A sloping line at the chart’s edge needs closer inspection before you label risk unlimited.
- Expiration-only models have limits. They don’t show the effects of changing volatility or early assignment, and they may exclude fees and other costs.
- Calendars and diagonals need additional modeling. One leg still has time value when the other expires, so intrinsic value alone is insufficient.
What a Payoff Analyzer Shows (and What It Doesn’t)
A payoff analyzer plots an option strategy’s expiration profit or loss against the underlying price. The horizontal axis shows the stock or index price used to determine expiration value. The vertical axis shows your gain or loss. Each point answers a specific question: if the underlying settles here, what is the modeled result?
That scope is narrow. The diagram doesn’t tell you what the position will be worth tomorrow or an hour before expiration. Those interim values depend on time remaining, implied volatility, and market prices. Also check the contract’s settlement rules: the relevant price isn’t always the closing price on the final trading day.
Payoff vs. profit. For a long call, payoff is the greater of zero and the underlying price minus the strike. Profit is that payoff minus the premium paid. Most analyzers plot profit, which is why a long call’s line stays below zero until the underlying rises enough to recover the premium.
OptCurve, for example, calculates expiration profit or loss from user-entered strikes, premiums, direction, contract count, and multiplier. This makes it useful for checking how those inputs affect the outcome, rather than estimating a live quote or forecasting a price. With any tool, confirm whether the chart shows expiration results only or includes pre-expiration estimates.
What the chart leaves out. OptCurve’s stated exclusions include fees, taxes, slippage, dividends, early exercise, and volatility changes. Other tools may let you add some costs, but a basic expiration line still doesn’t describe the path a position takes before settlement or the consequences of early assignment.
Calendar and diagonal spreads hold legs with different expiration dates. When the nearer-term leg expires, the longer-dated leg still has time value. To assess that position, you need a model that estimates the remaining option’s value using time and volatility assumptions, not intrinsic value alone.
Inputs You Need Before You Open the Tool
Before entering a position in OptCurve or another analyzer, gather these details:
- Strike price for every leg, meaning each individual option in the strategy.
- Premium paid or received for each leg, using the tool’s required units, usually per share for equity options.
- Direction: long means bought; short means sold.
- Contract count for each leg, including any unequal ratios.
- Contract multiplier. Standard U.S. equity options typically represent 100 shares. Check the product specifications, especially for adjusted or nonstandard contracts.
- Expiration dates. Different dates require a model that accounts for the remaining value of later-expiring legs.
- Underlying price range wide enough to reveal the relevant gains and losses.
Check exercise and settlement terms separately. American-style options can be exercised before expiration, exposing short positions to early assignment. European-style options cannot. Cash-settled contracts pay a cash amount, while physically settled contracts can create an obligation to deliver or receive shares. These operational differences may not be apparent from the payoff line.
Hands-on: Build and Read Your First Payoff Diagram
Start with one option before adding more legs. The examples below exclude costs and use one contract per leg with a 100-share multiplier. All legs within each spread share the same expiration.
A long call, step by step
Suppose a stock trades near 100 and you buy one call with a 100 strike for a premium of 3.00 per share. Enter the strike, premium, long direction, one contract, and the 100 multiplier.
The line is flat at a $300 loss for expiration prices at or below 100. Above 100, it rises by $100 for each $1 increase in the stock price. It reaches zero at 103, the strike plus the premium. Above that breakeven, profit continues rising without a fixed ceiling. The maximum loss on the option itself is the $300 premium, before costs.
Math box. Long-call profit per share at expiration = max(S minus K, 0) minus premium, where S is the underlying price at expiration and K is the strike. Multiply by the contract multiplier and contract count for the total dollar result. If exercise creates a stock position, that stock has its own ongoing risk, which this option-only diagram doesn’t show.
When using the Options Expiration Payoff Analyzer from OptCurve, check the zero crossing and the dollar scale against your own calculation. A correct-looking shape isn’t enough if the premium, direction, or contract size is wrong. Treat the result as an expiration scenario based on your inputs, not a live quote or recommendation.
The five-point scan
Read each diagram in the same order to make input errors easier to spot.
- Find where profit equals zero. These are the expiration breakevens. Then identify which price regions sit above and below zero. Two breakevens can enclose either a profitable or a losing region.
- Read the flat segments. A horizontal segment shows a constant result within that price region. Compare it with the whole chart before calling it the maximum gain or loss.
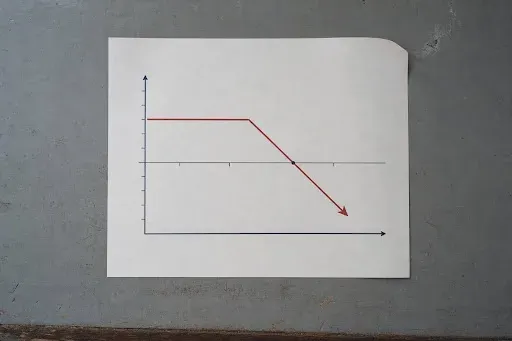
- Inspect the tails. An uncovered short call has unlimited loss potential as the stock rises. A sloping left tail is different: ordinary stock prices have a floor of zero, so a short put’s loss is large but finite.
- Match bends to strikes. Changes in slope generally occur at distinct strikes with remaining option exposure. Multiple legs can share a strike, so the number of bends needn’t equal the number of legs.
- Confirm the scale. Check whether the vertical axis shows per-share values or total dollars, and verify that contract counts and multipliers are included.
Move to Two-Leg and Four-Leg Structures
Adding legs changes the shape and can cap outcomes. Review the combined result, but also verify each leg separately.
A vertical spread
Keep the long 100 call at 3.00 and sell a 105 call for 1.50. The net debit is 1.50 per share, or $150 for one spread. The line is flat at a $150 loss at or below 100, rises between 100 and 105, then levels off at a $350 profit at or above 105. The breakeven is 101.50: the lower strike plus the net debit.
The short call lowers the entry cost and breakeven but caps the gain. Changing its strike changes both the spread width and the premium received. Re-enter the relevant premium each time rather than assuming that a wider spread always has the same cost.
An iron condor
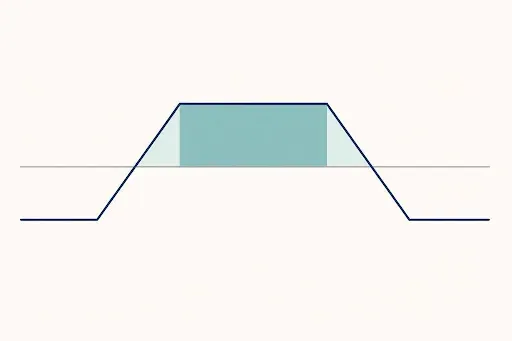
Sell a 95 put and buy a 90 put; sell a 105 call and buy a 110 call. Suppose the combined position brings in a credit of 1.80 per share. The line forms a flat plateau at a $180 profit between 95 and 105. It slopes down on either side and levels off at a $320 loss at or below 90 and at or above 110. The breakevens are 93.20 and 106.80, the short strikes adjusted by the credit.
This chart separates two ideas: the range where the full credit is retained and the wider range where the trade remains profitable at expiration. Moving the short strikes changes these ranges and the credit received. The final result also depends on the distance between each short option and its protective long option.
| Shape on the chart | Common example |
|---|---|
| One bend, flat on the left, rising on the right | Long call: capped option loss, uncapped gain |
| One bend, flat on the left, falling on the right | Uncovered short call: capped gain, unlimited loss potential |
| Two bends, flat at both ends | Vertical spread: capped gain and loss |
| V or inverted V, with one bend or a flat middle between two bends | Long or short straddle or strangle; downside outcomes remain bounded by a stock price of zero |
| Four bends, a flat central plateau, and flat outer floors | Standard short iron condor; an iron butterfly instead has three distinct strikes and a central peak |
 Compare Scenarios and Strategies Side by Side
A single diagram describes one position. Comparing diagrams shows the trade-offs between alternatives. Use overlays if available; otherwise, keep the price range, dollar scale, expiration, and position size consistent. An expiration-only tool such as OptCurve keeps this comparison focused on final outcomes rather than interim valuations.
Compare the long call and debit call spread above. The spread costs less and has a lower breakeven, but its profit stops at $350. The long call costs more but eventually earns more if the stock rises far enough. The diagrams show where that crossover occurs, without implying which outcome is more likely.
When comparing condors, distinguish the distance between the short strikes from the width of each protective wing. The first determines the full-credit region. For equal-width wings, maximum expiration loss per share is the wing width minus the net credit. A wider central plateau doesn’t automatically mean a larger maximum loss.
Before trusting a comparison, check the inputs:
- Every leg is marked long or short as intended.
- All legs share an expiration, or the model handles different dates.
- Premiums use the correct units and the tool’s convention for credits and debits.
- Contract counts and ratios match the intended position.
- Multipliers and contract specifications are correct for every leg.
Pre-Expiration Reality Check: Why T+0 Curves Differ
The expiration line describes a final outcome. It doesn’t describe the price at which you could close the position today.
Some platforms show a current-day curve, often labeled T+0, alongside the expiration line. For example, thinkorswim’s Risk Profile can display both views. The current-day curve is smoother because the options still have time value. It changes as time passes and implied volatility, the market’s pricing of expected price movement, changes. The expiration line stays fixed only while its inputs remain unchanged.
An underlying price inside a strategy’s expiration profit region doesn’t guarantee that closing the whole position now will produce a profit. Remaining time value on short legs, volatility, and the difference between buying and selling prices can affect the exit value.
This distinction also matters for calendars and diagonals. On the first expiration date, the later-expiring option still needs a modeled value. Keep the questions separate: the expiration line estimates a final result, while a current-day curve estimates value under today’s assumptions. Neither guarantees an executable price.
Risk Framing You Can Trust from an Expiration Chart
With correct inputs and a suitable model, the chart helps answer four questions:
- Where is loss capped? Inspect the complete payoff shape for its lowest value, not just one flat segment.
- Is any loss unlimited? Check how the position behaves beyond the displayed range, especially an uncovered short call as the stock price rises.
- What price is needed to break even? Read the zero-profit points and compare them with the current underlying price.
- Which final prices produce a profit? Read the regions above zero. These show expiration outcomes, not tolerable price paths or probabilities.
Three red flags deserve attention: an uncovered short call with unlimited loss potential, an incorrect multiplier that understates dollar exposure, and overlooked assignment risk. Short American-style options can be assigned before expiration. Short calls may be particularly exposed ahead of an ex-dividend date.
A displayed maximum loss assumes the modeled position and settlement outcome. Costs, mismatched exercise or assignment, and stock exposure created at expiration can change the practical result. It isn’t a limit on losses elsewhere in your portfolio.
Short-Dated Options: Why Timing Matters
A contract that expires soon leaves less time to respond to an input error or misunderstood position. The same checks still apply, even when the trade may last only a few hours.
- Verify the exact expiration. Similar-looking contracts can have different trading deadlines or settlement terms.
- Check assignment and exercise exposure. A limited-risk diagram doesn’t explain every operational consequence of holding through expiration.
- Separate the final payoff from the exit price. Even near expiration, the modeled line isn’t a quote at which you can close the trade.
Complete the review before entering the order, and consider rehearsing unfamiliar structures on a demo trading account first. A shorter holding period is a reason to prepare the inputs carefully, not to skip the risk check.
Tool Options: A Brief, Comparative View
Payoff tools differ mainly in what they model and where their inputs come from. Choose the type that answers your question.
- Expiration-only analyzers. OptCurve uses entered strikes, premiums, direction, contract counts, and multiplier to show expiration profit or loss. Its clearly defined scope is useful for checking breakevens and payoff limits without adding pre-expiration valuation assumptions.
- Web calculators with pre-expiration estimates. Tools such as OptionsProfitCalculator.com and OptionStrat can help explore values across dates and prices. These estimates require assumptions about volatility and time; check the pricing model and data freshness.
- Broker risk graphs. Platforms such as thinkorswim, IBKR’s Performance Profile, and Power E*TRADE’s TradeLab provide payoff views alongside trading tools. Check whether a chart uses existing positions, proposed orders, or manually entered values, and which costs it includes.
Whichever category you choose, read the documentation for two things: whether the chart includes pre-expiration estimates and what assumptions or costs it leaves out.
A Pre-Trade Checklist
Before placing a trade, review these seven items with the diagram in front of you:
- Verify every leg, strike, and expiration date against the intended trade.
- Check premiums, units, and the treatment of credits and debits.
- Confirm contract counts and multipliers so the dollar scale is correct.
- Check the breakevens against the current underlying price.
- Review the modeled maximum loss and any exposure beyond the displayed price range.
- Identify short legs with early assignment risk and any settlement-related stock exposure.
- Record excluded costs and assumptions, and use a separate model if you need pre-expiration values.
Whether you use OptCurve, a broker risk graph, or a spreadsheet, the useful result is the same: a clearer view of expiration risk under stated assumptions. Check the numbers as well as the shape, and keep that final payoff separate from the price you might receive when exiting early.


