


FX & Currencies
Technical Analysis EUR/USD: Breakdown?
15 May 2016


Currency market shared some intensity this week, not much to celebrate regarding massive pips accumulation. Today’s Technical Analysis EUR/USD covers all the necessary information every forex beginners, trader, super trader, wannabe trader and institutional desk may need. Let’s review technicals; you can do fundamentals somewhere else because trading is a function of risk.
-H4 Chart: Japanese Candlestick
-Daily Chart: Resistance and Support
-Weekly Chart: Fibonacci Levels
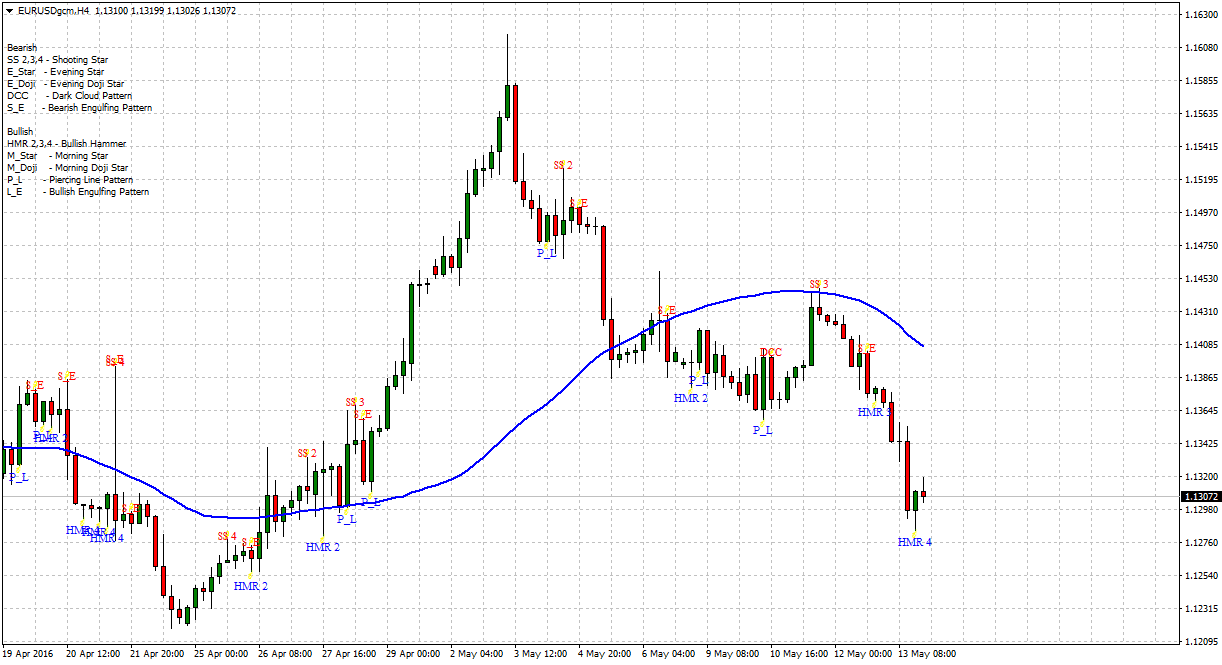
First off, H4 (four-hour chart) not difficult to understand a short-term bearish tone is in the making. Price action confirmed it since May 6th, closing below the 50 SMA (blue color) there the euro trades +55 pips to the downside and bounce back. On May 11th, fails to break and sustain gains above 1.1440, behaving as resistance we can see the same 50 SMA again.
To the left, we can find full description on the candlesticks used. Focus now, on two distinct patterns: Bullish Hammer and Piercing Line.
Based on previous levels, our research team at tradersdna thinks an opportunity to add euros will develop next week as long as the “expectations” to have a brilliant magic trick on the Fed’s hand dissipate. (hard to believe they dare to adjust interest rates)
The EUR/USD zone 1.1280/1.1340 had a Bullish Hammer pattern, somewhere on April 27th, pushing the euro +300 pips to the upside. As one of the greatest in LATAM explains, Mr. Adrian Aquaro: “The Market has memory, but participants don’t.” that zone makes me think there are plenty buyers to come back and support 1.1250/1.1270 during next week’s sessions.
Again, on H4 price action close to 50 SMA is the only development will make me cautious about exiting any short-term long positions, as it is evident all bullish effort is invited to encounter resistance around 1.1400.
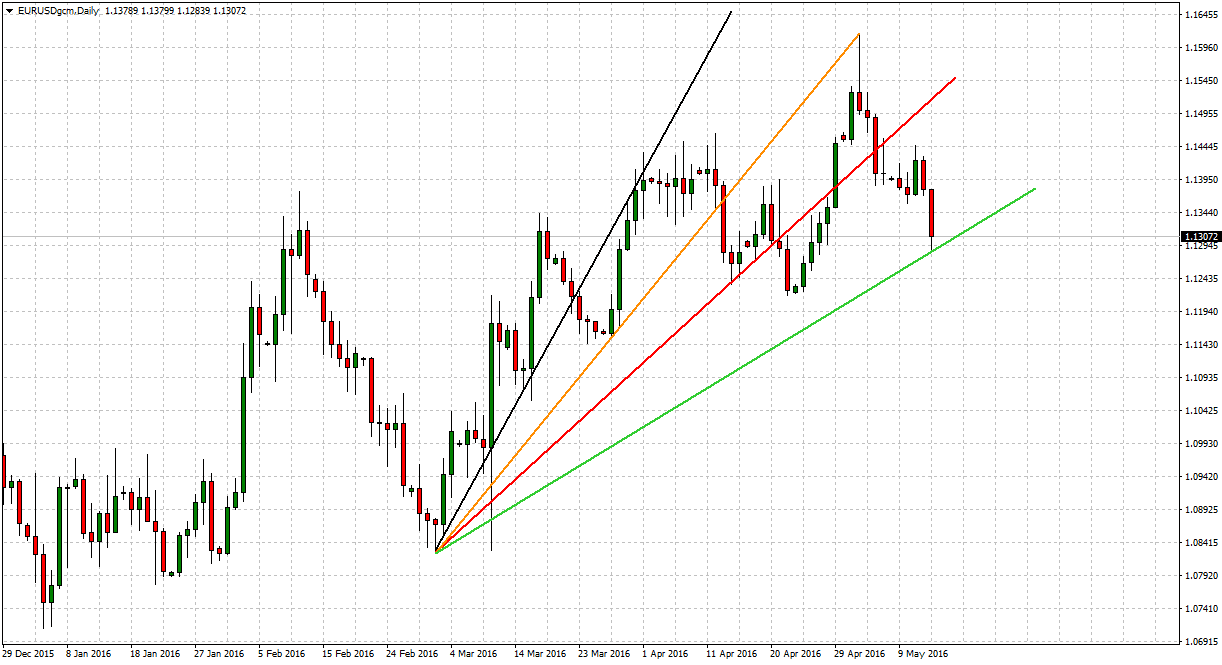
Moving to the daily chart, note during this Technical Analysis EURUSD, there are just a few traditional tools, of course, besides what we believe are the most relevant charts to scan before you make the decision to place a trade. It is paramount to reduce any possible noise from your decision-making process to improve your outcome.
Note how price action pushed from December’s lows around 1.0700/1.0740, then congestion for couple weeks and a jump towards 1.1344. If you were to think like a big market player, the congestion is when you draw attention from retail, speculators and new market participants.
Do you remember the buzz (called it professional news) about the EURUSD by end’s year? Yes, that’s right! Market sentiment was such a pessimist; it is impossible to recall how many times the pair got killed by many based on such deeply fundamental logic. Remember, participants perspective matters, but it is worth to be a contrarian.
Back in March, we witnessed the beginning of a bullish channel that has its roots at 1.0860/1.0840 there we are going to use trendlines to give us an idea or map to follow and mark estimated zones to trade.
The light green bullish trendline measures a new support protecting what I think is the euro bullish momentum. If prices close and open below 1.1300, then expect a quick bearish scenario where prices can trend lower towards 1.1080/1.0980. However, if it holds and the risk makes sense for your trading plan, you can easily buy risk targeting 1.1400, just do not risk more than 50 pips “if” that’s what you decide to do this week.
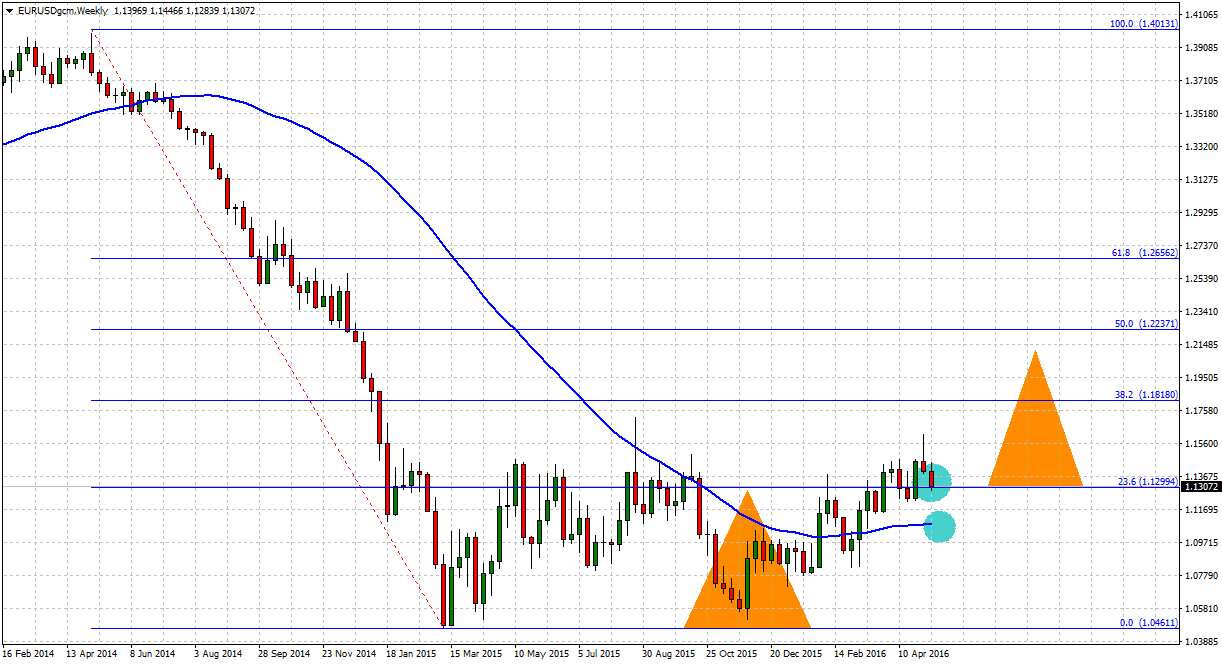
Finally, I have been playing with this “Triangle” idea, like most of my peers (that they live and die to draw objects) the concept of market height and depth attracts my curiosity and couldn’t resist starting using it here with the Fibonacci flavor.
Not a surprise, we have Fibonacci level 23.6% 1.1299 on the weekly chart, if prices hold then we cannot forget about Fibonacci 38.2% 1.1818 to the upside. There is the short Brexit subject that no one can forget I even heard a referendum is in the making; fancy that. It is impressive how the EU loves to waste euros all day long.
But, going back to the Triangle thing, if we were to take the depth or foundation and then use the height we can expect the following: prices are going to find support and rise towards Fibonacci 50.0% 1.2237 remember, that is just an observation. To keep this idea alive, I will be a buyer all the way between 1.1150/1.0980, then targeting 1.1600/1.1820.
Let’s leave it here on our Technical Analysis EURUSD; I am sure it will add value to your trading plans. Feel free to share it with anyone you may think can use the information. As usual, let me know your thoughts on the EURUSD and the Brexit drama. I will answer all comments.
Until next week with more adrenaline and Forex trading ideas!
Read More:
when is the target car seat trade-in 2025
charles schwab | a modern approach to investing & retirement | charles schwab


