
Markets & Investing, Trading Strategies & Tech
Mastering the Markets: Your Essential Trading Chart Patterns Book Guide
25 Mar 2026

So, you want to get better at trading? Maybe you’ve heard about chart patterns and how they can help. It’s true, they can be a really useful part of your trading plan. But there’s a lot of confusing stuff out there. This guide, like a good trading chart patterns book, aims to clear things up. We’ll break down what really matters when it comes to using chart patterns, cutting through the noise so you can focus on what works. Let’s get started.
Key Takeaways
- Chart patterns don’t predict the future perfectly, but they help you read market conditions and manage risk.
- Knowing every single chart pattern isn’t necessary; understanding price action and context is more important.
- Trading in the direction of the main trend, looking for areas of value, and seeing a buildup before a breakout increases your chances of success.
- Use the structure of chart patterns to set logical stop-loss levels, protecting your capital.
- A solid trading plan incorporates chart patterns, but also considers market psychology and requires ongoing learning.
Understanding The Core Principles Of Trading Chart Patterns

Alright, let’s talk about chart patterns. You see them everywhere, people swear by them, but what’s really going on? It’s easy to get lost in all the different shapes and names, thinking you need to memorize a hundred of them to be a successful trader. But honestly, that’s not the way to go. The real magic happens when you understand the underlying forces driving the price.
Debunking Common Trading Chart Pattern Myths
First off, let’s clear the air. A lot of folks think chart patterns are like a crystal ball, predicting the future with perfect accuracy. That’s just not true. No pattern, no indicator, can tell you with 100% certainty what the market will do next. If you see a pattern and jump in thinking it’s a guaranteed win, you’re setting yourself up for disappointment. Patterns don’t predict; they help you assess probabilities and manage risk.
Another myth is that chart patterns just don’t work. This usually comes from traders who try to use them in isolation, without considering the bigger picture. A pattern that looks great in a vacuum might fail miserably if it’s going against a strong trend. Context is everything.
Finally, you absolutely do not need to know every single chart pattern out there. Seriously, there are tons of them. Trying to memorize them all is a recipe for burnout. Instead, focus on understanding the price action itself.
The Importance Of Context In Chart Pattern Trading
Think about it like this: you wouldn’t try to diagnose a medical condition based on just one symptom, right? The same applies to trading. A chart pattern is just one piece of the puzzle. You need to look at where it’s appearing. Is it happening in an uptrend, a downtrend, or a sideways market? What’s the overall market sentiment?
For example, a bullish pattern like a rounding bottom might signal a potential upward move. But if it appears after a long, strong downtrend and is happening at a key support level, it carries more weight than if it pops up randomly in the middle of nowhere.
Here’s a quick way to think about context:
- Trend Direction: Is the market generally moving up, down, or sideways?
- Market Structure: Are we seeing higher highs and higher lows, or lower highs and lower lows?
- Key Levels: Is the pattern forming near significant support or resistance areas?
Understanding the market’s current state is more important than the specific shape of the pattern itself. A pattern in alignment with the prevailing trend has a much higher chance of success.
Mastering Price Action Over Memorization
So, how do you get good at this without memorizing a million patterns? Focus on reading the price action. This means looking at the actual movement of the price on the chart. You need to understand three main things:
- Trending Moves: These are the strong, directional pushes in the market. Think of them as the ‘big’ moves where one side (buyers or sellers) is clearly in control.
- Retracement Moves: These are the smaller, counter-trend moves that happen within a larger trend. They’re like pauses or pullbacks before the main trend potentially continues.
- Swing Points: These are the peaks (swing highs) and valleys (swing lows) where the price reverses direction. They help you define the trend and identify potential turning points.
By understanding these three elements, you can interpret almost any chart pattern without needing to recall its specific name or definition. It’s about seeing the story the price is telling you, not just recognizing a shape.
Decoding Chart Patterns For High-Probability Setups
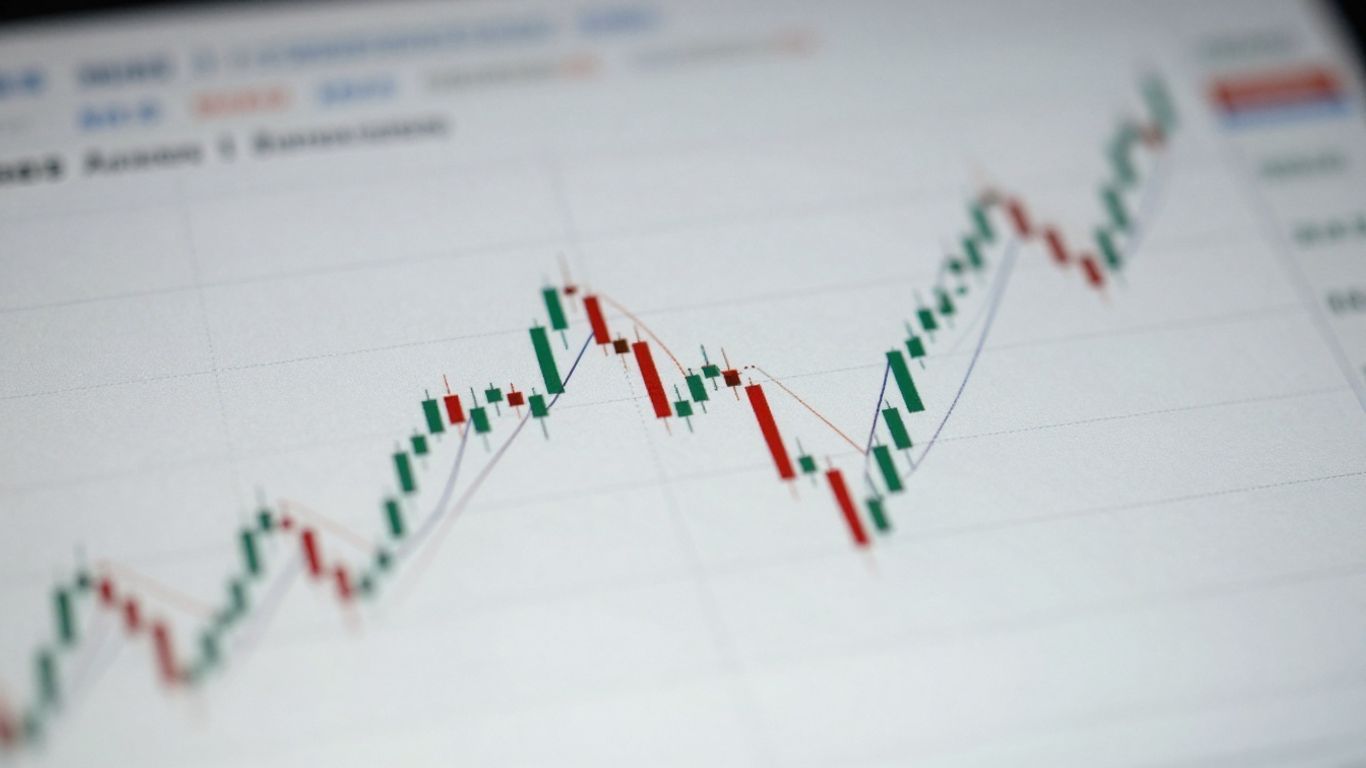
So, you’ve seen a chart pattern. Great. But how do you know if it’s actually going to work out? Not all patterns are created equal, and just spotting one isn’t enough. We need to stack the odds in our favor. Think of it like picking a stock – you wouldn’t just buy any company, right? You look for specific things. Trading patterns is similar. We need to look beyond the shape and consider the bigger picture.
Leveraging Trend Direction For Pattern Success
This is probably the most repeated advice in trading, and for good reason: the trend is your friend. Trying to catch a falling knife or betting against a strong uptrend is a tough way to make money. When you see a bullish pattern, like a flag, it’s best to look for it in an existing uptrend. Likewise, a bearish pattern makes more sense in a downtrend. Trading with the trend means you’re swimming with the current, not against it. It’s a simple concept, but it makes a huge difference in how often your trades work out.
Identifying Areas Of Value For Optimal Entry
Where do you buy your groceries? Probably where you think the price is fair, or even a good deal. Trading is no different. We want to enter trades when the price is at an ‘area of value’. This means looking for places on the chart where price has historically found support or resistance, or where it’s near a key moving average or trendline. When a pattern forms in one of these areas, it suggests that the market participants are agreeing on a price level. For example, seeing a bullish reversal pattern form right at a strong support level significantly increases the chances of a successful trade compared to seeing the same pattern in the middle of nowhere.
The Role Of Buildup In Breakout Trades
For patterns that lead to breakouts, like triangles or rectangles, a ‘buildup’ phase is often a good sign. This is when the price starts to consolidate or move sideways within the pattern, often with decreasing volatility. It’s like a coiled spring. This period of reduced movement can indicate that a significant move is brewing. When the price finally breaks out of this buildup phase, especially in the direction of the prevailing trend, it can signal the start of a strong new move. Waiting for this buildup before entering a breakout trade can help filter out false signals and improve your entry timing.
Trading patterns isn’t about memorizing shapes. It’s about understanding market psychology and structure. Look for patterns that align with the overall trend and form at logical price levels. A buildup before a breakout can add extra confirmation. These steps help turn a simple pattern observation into a high-probability setup.
Essential Chart Patterns For Your Trading Toolkit
Alright, so we’ve talked about the big picture stuff, but now let’s get down to the nitty-gritty: the actual patterns you’ll see on your charts. Knowing these can really help you spot opportunities. It’s not about memorizing a million shapes, though. It’s more about understanding what they mean in the context of the market.
Recognizing Continuation Patterns Like Flags And Pennants
These patterns show up when the market takes a little breather before continuing its main move. Think of it like a runner pausing for a quick sip of water before sprinting again. Flags and pennants are classic examples.
- Flags: These look like small rectangles, usually with parallel lines, forming against the main trend. The price action is consolidating within these lines.
- Pennants: Similar to flags, but they look more like tiny triangles. They also form during a pause in a strong trend.
When you see these, especially after a strong move, it’s often a signal that the trend is likely to pick up where it left off. The key is to wait for the price to break out of the flag or pennant in the direction of the original trend.
Identifying Reversal Patterns Such As Head And Shoulders
Reversal patterns are the opposite of continuation patterns. They signal that the current trend might be losing steam and a change in direction is coming. The Head and Shoulders pattern is a big one here.
- Formation: It’s made up of three peaks. The middle peak (the "head") is the highest, with two smaller peaks on either side (the "shoulders").
- Neckline: A line drawn connecting the lows between the peaks. This is your trigger line.
- Signal: When the price breaks below the neckline after forming the second shoulder, it’s a strong indication that the trend is reversing, usually from an uptrend to a downtrend.
There’s also an "Inverse Head and Shoulders" which works the same way but signals a potential bottom and reversal from a downtrend to an uptrend.
Understanding Double Tops And Bottoms
These are pretty straightforward and quite common. They signal a potential reversal when the price hits a certain level twice without being able to break through.
- Double Top: The price rallies up to a resistance level, pulls back, and then rallies again, failing to break the previous high. This forms a shape like the letter ‘M’. It suggests that selling pressure is building at that resistance level.
- Double Bottom: The opposite of a double top. The price falls to a support level, bounces, and then falls again, failing to make a new low. This looks like the letter ‘W’. It indicates that buying interest is emerging at that support level.
For both double tops and bottoms, you’re looking for a break of the "neckline" (the low point between the two tops, or the high point between the two bottoms) to confirm the reversal. These patterns are great because they give you a clear level to watch for confirmation.
Strategic Application Of Chart Patterns In Trading
Okay, so you’ve learned about some common chart patterns, like flags, pennants, and head and shoulders. That’s great! But knowing what they look like is only half the battle. The real magic happens when you figure out how to actually use them in your trades. It’s not just about spotting a pattern; it’s about how you act on it.
Trading Breakouts With A Buildup Strategy
When a chart pattern suggests a breakout is coming, especially those with clear boundaries like a double top or a symmetrical triangle, you want to see a little something extra before you jump in. This ‘something extra’ is what traders call a ‘buildup’. Think of it as the market taking a deep breath before a big move. It’s often seen as a period where price action gets tighter, forming a smaller consolidation right before the breakout. This contraction in volatility can signal that energy is building up, and when it finally breaks, the move can be quite strong.
- Look for tightening price ranges: The candles get smaller, and the price action moves within a narrower band.
- Volume might decrease: Sometimes, volume can drop during the buildup phase as traders wait for confirmation.
- Patience is key: Don’t rush the entry. Wait for the actual breakout to occur.
A buildup phase before a breakout can significantly increase the odds of a successful trade. It shows that after the pattern formed, there was a period of indecision or consolidation that eventually resolved in the direction of the breakout.
Setting Stop Losses Based On Pattern Structure
Figuring out where to place your stop loss is super important. You don’t want to get stopped out by a tiny bit of noise, but you also don’t want to give back all your potential profits if the trade goes against you. The best place for a stop loss is usually just beyond a point that would completely invalidate the chart pattern you’re trading. For example, if you’re trading a bullish flag pattern and expecting a move higher, your stop loss might go just below the lowest point of the flag itself. If the price drops below that, the pattern is likely broken, and you’d want to be out.
Here’s a simple way to think about it:
- Continuation Patterns (e.g., Flags, Pennants): Place stops below the pattern’s low for bullish patterns, or above the pattern’s high for bearish patterns.
- Reversal Patterns (e.g., Head and Shoulders): For an inverse head and shoulders, place the stop below the right shoulder or the lowest point of the pattern. For a standard head and shoulders, place it above the right shoulder or the highest point.
- Range-Bound Patterns (e.g., Double Tops/Bottoms): Place stops just beyond the ‘neckline’ or the peak/trough of the pattern.
Managing Risk With Chart Pattern Insights
Chart patterns aren’t just about finding entry points; they’re also a big help in managing your risk. By understanding the structure of a pattern, you can get a good idea of where the market might go if the pattern fails. This helps you set realistic stop-loss levels and position sizes. The goal is to risk only a small percentage of your trading capital on any single trade. If a pattern suggests a potential move of, say, 100 pips, and your stop loss is 25 pips away, that’s a 4:1 reward-to-risk ratio, which is pretty good. If the stop loss is 75 pips away, that’s a much weaker ratio, and you might want to reconsider the trade or adjust your position size.
- Assess the pattern’s validity: Know the invalidation point for each pattern.
- Calculate risk-reward: Ensure potential profits outweigh potential losses.
- Adjust position size: Use stop-loss distance to determine how much you can trade without overexposing your account.
Advanced Techniques For Trading Chart Patterns
Analyzing Trending And Retracement Moves
When you look at a chart, it’s not just about spotting a pattern. You really need to see the bigger picture. Think about the main direction the price is going – that’s your trend. Then, there are those smaller moves against the trend, which we call retracements. Understanding how strong the main trend is and how deep these retracements go tells you a lot about what might happen next. If a trend is strong, retracements are usually shallow and short-lived. But if the trend is weakening, retracements might get deeper and last longer, sometimes even signaling a potential change in direction.
Utilizing Swing Points To Gauge Market Direction
Swing points are those peaks and valleys on a price chart where the direction temporarily changes. They’re like signposts showing where buying or selling pressure might be shifting. If you see a series of higher swing highs and higher swing lows, that’s a pretty clear sign of an uptrend. Conversely, lower swing highs and lower swing lows point to a downtrend. Watching how these swing points form and interact is key to figuring out the market’s current mood and likely path.
- Uptrend Confirmation: Higher highs and higher lows.
- Downtrend Confirmation: Lower highs and lower lows.
- Potential Reversal: Failure to make new highs in an uptrend, or new lows in a downtrend.
Combining Chart Patterns With Other Technical Tools
No single tool tells the whole story in trading. Chart patterns are powerful, but they work even better when you use them alongside other indicators. Think of it like using a map and a compass together. You might spot a bullish flag pattern, which suggests the price could go up. But if you also see that the price is near a strong support level or a key moving average, that adds extra confirmation. It’s about building a case for your trade using multiple pieces of evidence, not just one.
Here’s a simple way to think about combining tools:
| Chart Pattern Signal | Supporting Indicator | Potential Trade Bias |
|---|---|---|
| Bullish Flag | RSI above 50 | Long |
| Bearish Flag | RSI below 50 | Short |
| Double Bottom | MACD bullish crossover | Long |
| Double Top | MACD bearish crossover | Short |
Relying solely on one chart pattern without considering the broader market context or other technical signals can lead to missed opportunities or unnecessary losses. Always look for confluence.
Building A Robust Trading Plan With Chart Patterns
Chart patterns aren’t some magic switch. They’re part of a bigger process, especially if you want to trade with consistency. If you’re serious about putting all the odds in your favor, you need a well-constructed trading plan. This plan becomes your go-to roadmap, telling you exactly how, when, and why you’ll use chart patterns in your trades. You don’t want to be the trader who jumps in and out on a whim — rules provide structure and consistency.
Integrating Chart Patterns Into Your Trading Strategy
You want to make chart patterns work for you, not the other way around. Here’s how to bring them into your process:
- Pick just a few chart patterns to focus on. It’s better to master three than to be confused by thirty.
- Match those patterns with market conditions. For instance, use continuation setups in trending markets.
- Decide how you’ll confirm a signal. Maybe you want a moving average confluence or a clear breakout before entering.
- Define your criteria for valid and invalid patterns. If the pattern gets invalidated, you avoid forced trades.
Start small and clear. The fewer variables you juggle at first, the easier it is to stick to your method when things get tough.
The Psychology Of Trading Chart Patterns
It’s one thing to spot a double bottom. It’s another to follow your plan in real time. You’ll face temptation to skip steps or trade outside your rules. That’s just human. You need to recognize when your emotions try to nudge you off track.
- Be mindful of revenge trading after a loss.
- Resist the urge to jump in early before your pattern is actually valid.
- If the market moves without you, that’s okay. Opportunities come and go.
Sometimes a quick breather — or a short walk — tones down the urge to act on impulse. Remember, discipline is where most trading plans succeed or fail.
Continuous Learning And Adaptation In Pattern Trading
No trading plan is finished forever — market conditions shift, patterns evolve, and so do you. The moment you stop adapting, you begin slipping behind.
Structured tracking helps a lot. Use a basic log like the one below:
| Trade # | Pattern Used | Market Type | Result | Notes |
|---|---|---|---|---|
| 1 | Bull Flag | Uptrend | Win | Good confirmation |
| 2 | Head/Shoulders | Range | Loss | Entered too early |
| 3 | Double Bottom | Volatile | Win | Patience paid off |
Set aside time — maybe weekly — to review your trades, seeing what worked and what didn’t. Adjust your plan as you go. For a step back on structure, check how a trading plan outlines each strategy and tool for greater consistency.
- Log every trade’s setup, risk, and result.
- Update rules if your chosen patterns stop performing.
- Accept that not every market period will be friendly to your approach. Adapt, but don’t chase every fad.
The only way to improve is by tracking and tweaking. Constant curiosity and honest reviews keep you headed in the right direction.
Wrapping It Up
So, we’ve gone over how chart patterns aren’t some magic crystal ball, and you definitely don’t need to memorize every single one out there to be a decent trader. The real trick is understanding the market’s direction, spotting areas where prices might be a good deal, and looking for those setups with a bit of buildup before a potential move. Remember, patterns work best when they line up with the overall trend. Keep practicing, keep learning, and you’ll get the hang of it. Now, what patterns do you find yourself using the most? Let us know in the comments below!
Frequently Asked Questions
Can chart patterns perfectly predict what the market will do next?
No, chart patterns aren’t like a magic crystal ball. They can’t tell you the future exactly. Instead, they help you understand the current market mood and how to manage your money better when trading.
Do I need to learn every single chart pattern out there?
Not at all! There are tons of patterns. It’s more important to understand the basics of how prices move – like when prices are going up strongly, pulling back a little, or making new highs and lows. This helps you figure out any pattern without memorizing them all.
When should I trade a chart pattern?
It’s best to trade along with the main direction the market is moving (the trend). Also, look for patterns that form in areas where prices tend to be ‘cheap’ (support) or ‘expensive’ (resistance), and wait for a ‘buildup’ before a breakout.
How do I know if a chart pattern will actually work?
You can’t know for sure if a pattern will work perfectly in the future. What you can do is make sure your trades have a good reason behind them and that you’re using them in the right market conditions. This increases your chances of success over time.
Can I use these chart patterns in different markets, like stocks and forex?
Yes, absolutely! The ideas behind chart patterns and how prices move are pretty much the same whether you’re looking at stocks, currencies (forex), or other types of markets.
How do I set my stop loss when trading a chart pattern?
A smart way to set your stop loss is at a price level that would ‘break’ or ‘ruin’ the chart pattern if the price reached it. This gives you a clear point to exit the trade if things go wrong, helping you manage your risk.


