How many SMEs, Startups, and Public Companies are in the world?
10 Mar 2026

Global & Regional Business Statistics: Top Global Economic Macro Numbers and the Top 20 Economies (2024–2026)
As of January 2026, the global business landscape is defined by a massive base of small-scale agility supporting a thin tier of corporate giants. This report synthesises the latest data from the IMF, World Bank, UN, and specialised trackers like Visual Capitalist and DemandSage to provide a definitive count of the world's commercial entities.

1. Global SMEs Macroeconomic Snapshot (2026)
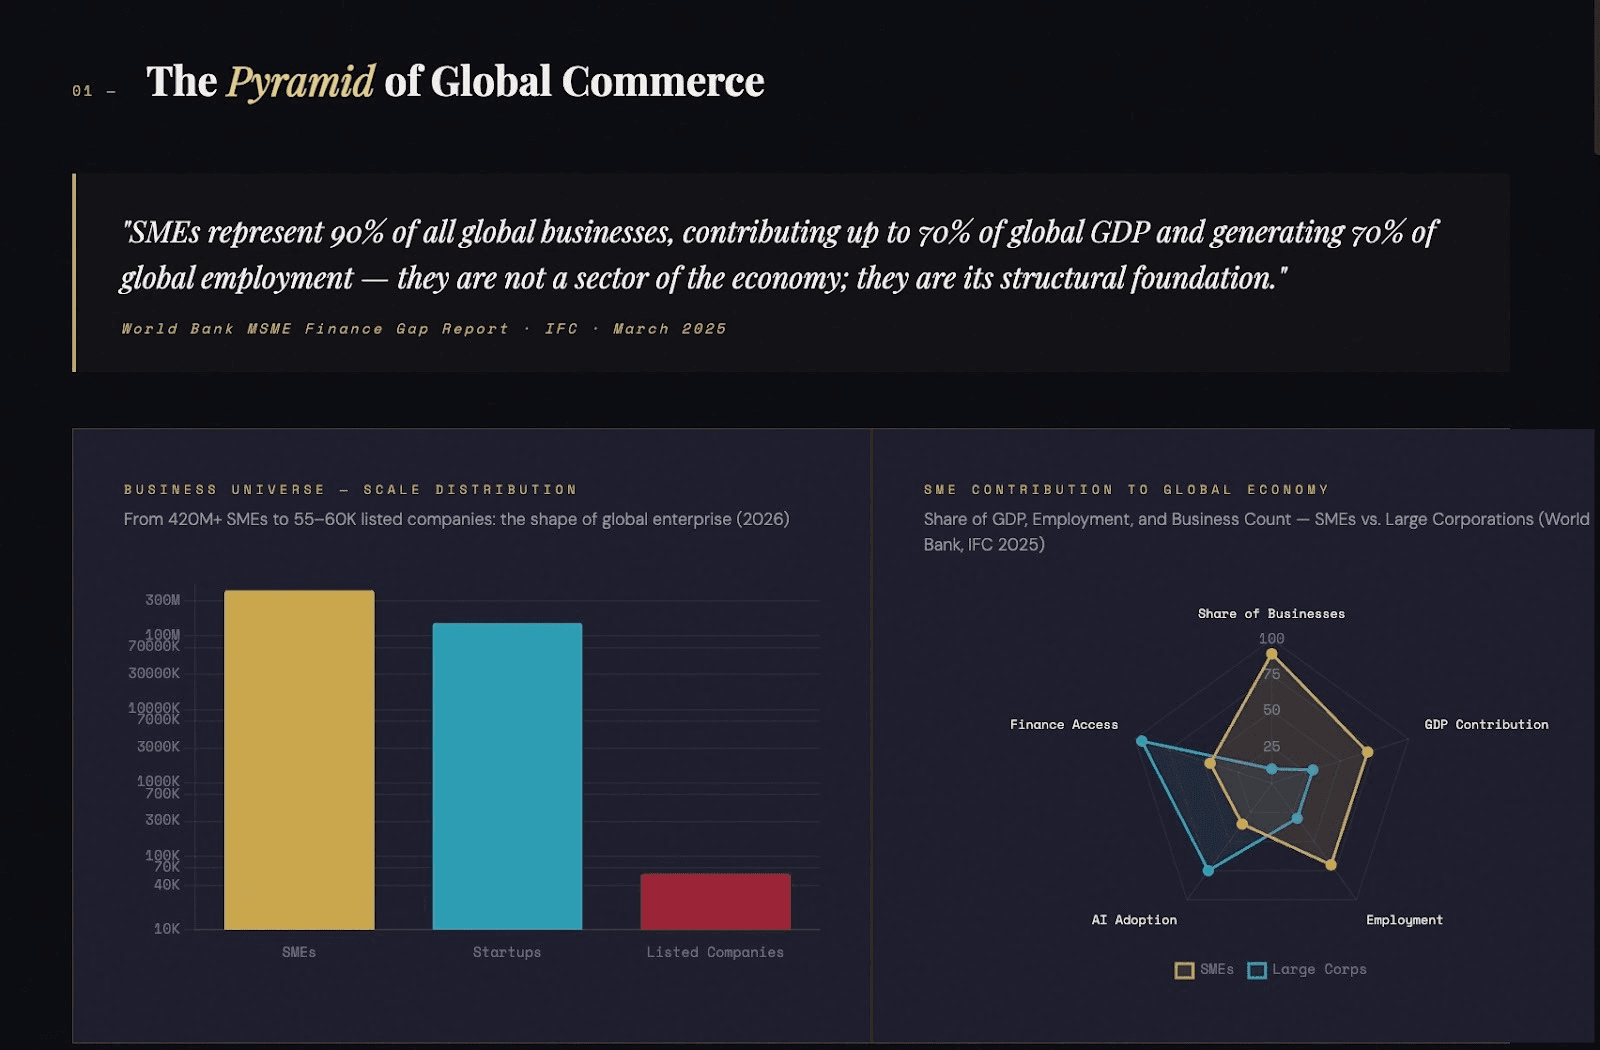
The global economy is projected to reach $123.6 Trillion in 2026. The distribution of businesses across this wealth follows a "pyramid" structure:
- SMEs (Small & Medium Enterprises): ~420 Million+ globally.
- Startups: ~150 Million (with ~50 million new launches annually).
- Publicly Traded Companies: ~55,000–60,000 active listings worldwide.
Source: World Bank SME Finance (March 2025); IMF World Economic Outlook (Oct 2025); Microsoft/DemandSage Startup Tracker (Jan 2026).
In 2026, the global SME landscape is defined by sturdy yet uneven resilience. While the post-pandemic recovery is entering its seventh year, SMEs are navigating a "triple transition": AI adoption, supply chain regionalisation, and tightened financial conditions.
The following macroeconomic snapshot outlines the state of the sector as of early 2026.
Global Growth & Contribution
- Economic Contribution: SMEs remain the "engine room," representing 90% of all global businesses and contributing up to 70% of global GDP.
- Global GDP Forecast (2026): Projected growth is roughly 2.8% to 3.2%. While positive, this is below the pre-pandemic average of 3.2%, signaling a "new normal" of moderate growth.
- Employment: SMEs generate 70% of global employment. However, a tightening labor market and "stagnant jobs" in developed economies (like the UK) are pushing SMEs toward automation.
The Financing Gap (2026 Data)
The "Credit Gap" remains the single largest hurdle for SME expansion, though digital innovation is starting to narrow it.
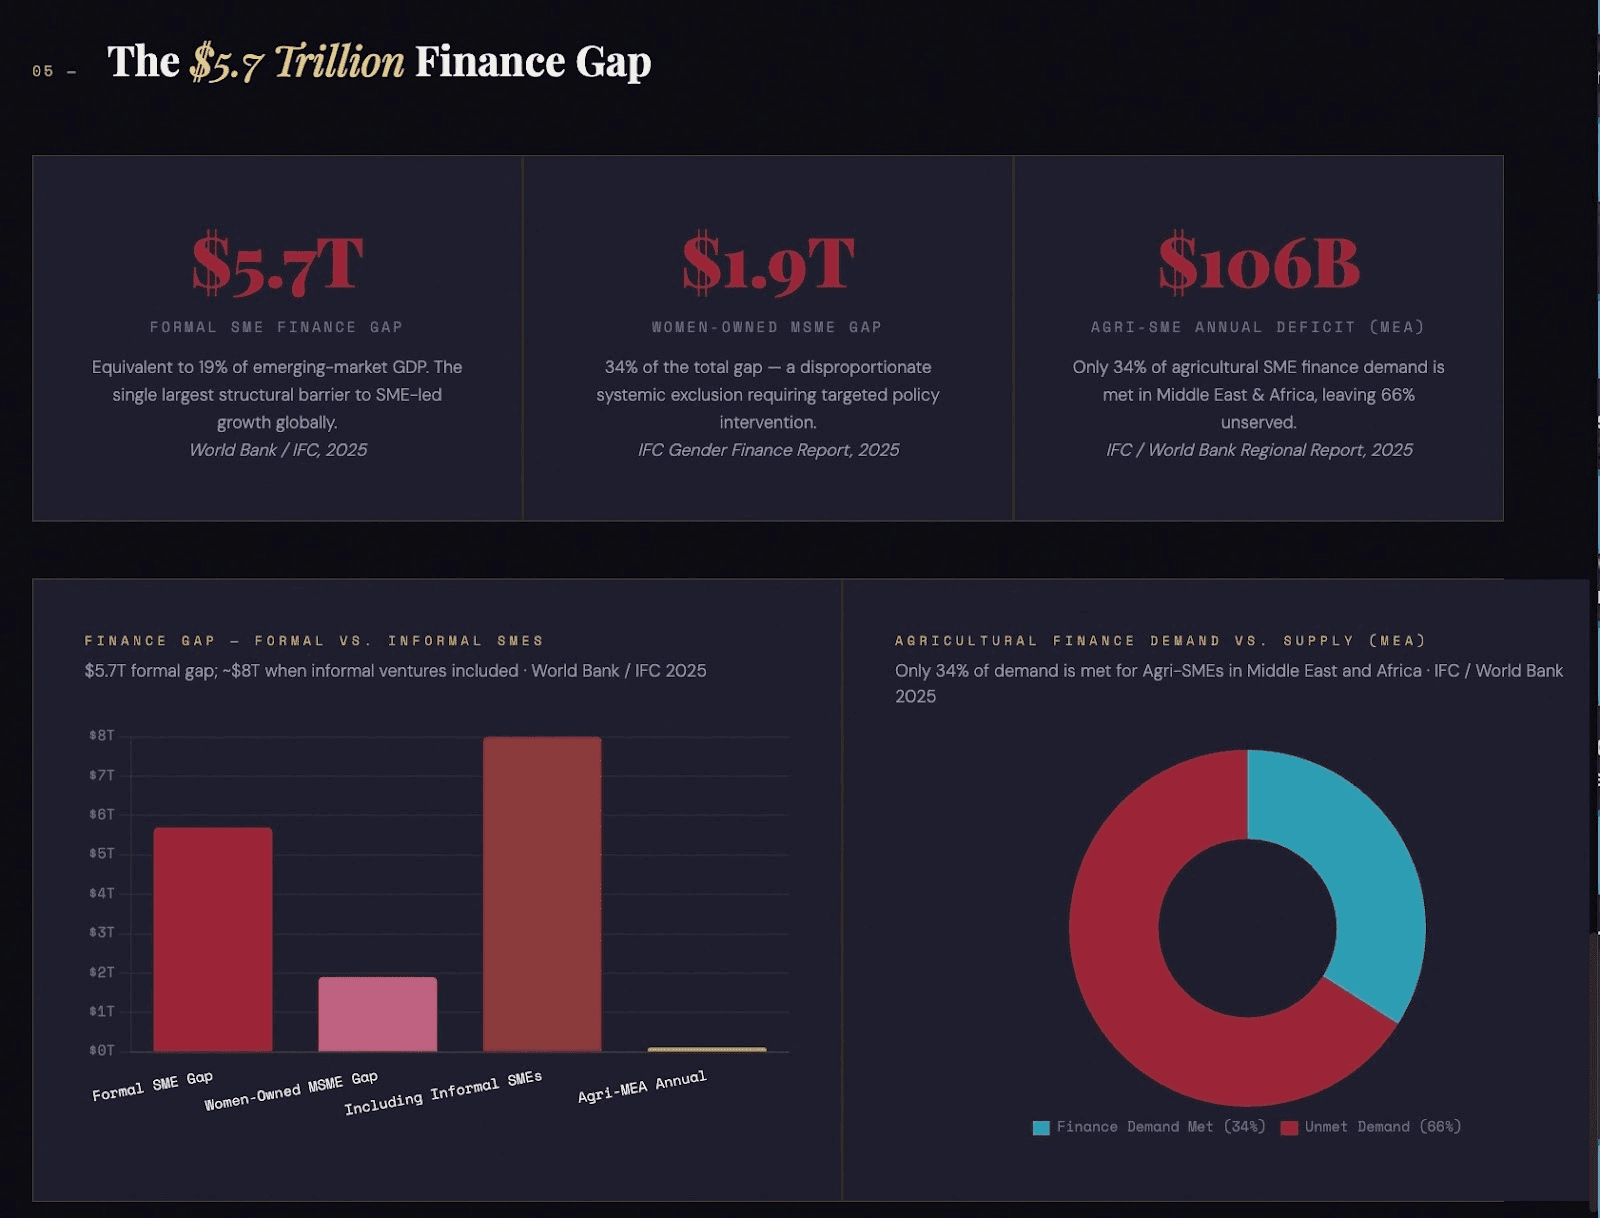
- The Global Hole: The World Bank and IFC estimate a $5.7 trillion finance gap in emerging markets, equivalent to 19% of their total GDP.
- The Gender Gap: Women-owned MSMEs face a disproportionate $1.9 trillion shortfall (roughly 34% of the total gap).
- Agri-SME Deficit: In the Middle East and Africa, only 34% of the demand for agricultural SME finance is met, leaving a $106 billion annual gap for small-scale producers.
Regional Macro Snapshots
| Region | 2026 Growth Forecast | Key Macro Driver for SMEs |
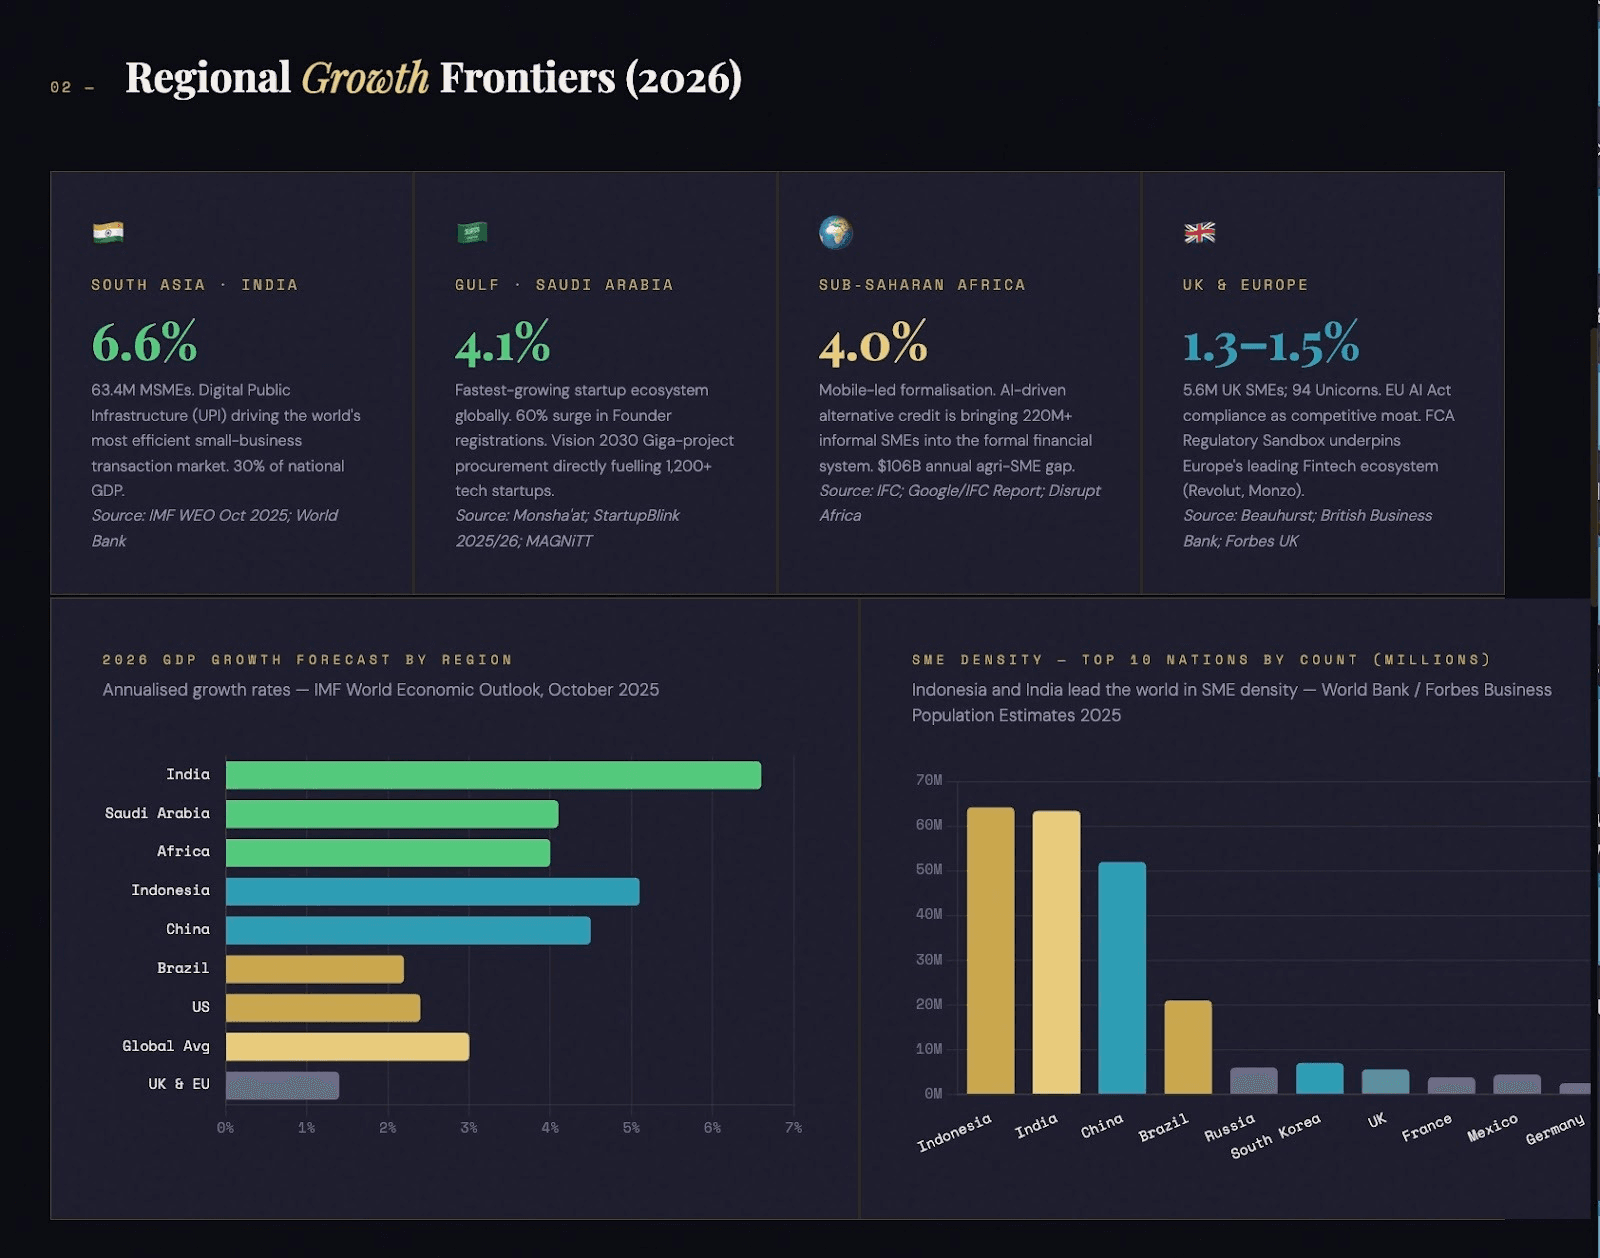
| UK & Europe | 1.3% – 1.5% | Regulatory Compliance: SMEs are pivoting to the EU AI Act and "Green Deal" reporting as competitive assets. |
| Saudi Arabia | 4.1% | Vision 2030 Momentum: Massive public investment in construction and logistics is fueling a 60% increase in "Founder" registrations. |
| Africa | 4.0% | Mobile-Led Formalisation: High debt levels are a risk, but AI-driven alternative credit is formalising millions of micro-SMEs. |
| South Asia (India) | 6.6% | Public Investment: India leads global growth, driven by resilient domestic consumption and digital infrastructure. |
Top Macro Trends Affecting SMEs
- Agentic AI Productivity: 2026 marks the shift from "Chatbots" to "Autonomous Agents." 65% of SME leaders now cite AI as their primary growth engine, using it to manage cash flow and administrative "heavy lifting."
- Nearshoring & Resilience: Following years of trade disruption, SMEs are moving away from "Just-in-Time" to "Just-in-Case" supply chains. Resilience now rivals efficiency as the top priority.
- Embedded Finance Expansion: Banking is no longer a separate destination. SMEs are increasingly accessing credit and insurance directly within their accounting software (Xero, Sage) or eCommerce platforms.
- The "Survival over Expansion" Paradox: Despite optimistic revenue projections, 67% of SMEs globally still identify survival as their primary challenge due to rising operational costs and interest rates staying “higher for longer.”
2. SMEs: The Global Backbone
In 2026, the description of SMEs as the "Global Backbone" is more than a metaphor, it is a statistical reality. As large corporations consolidate and automate, the global economy is increasingly reliant on the agility of smaller units.
Here is an elaboration on the key pillars of this 2026 macroeconomic shift.
2.1. The Numbers: Formal vs. Informal
While there are roughly 420 million SMEs globally, the distinction between "formal" and "informal" is critical for 2026:
- Formal SMEs: Approximately 150-200 million businesses that are registered and tax-compliant. These are the primary targets for the AI-banking innovations discussed earlier.
- Informal SMEs: Over 220 million businesses, largely in the Middle East, Africa, and SE Asia. In 2026, "Fintech Formalisation" is the biggest trend, using AI to give these businesses a "digital identity" so they can access their first formal bank loans.
2.2. The Rise of "High-Impact Solo-Enterprises"
The most significant shift in 2026 is the birth of the "Company of One." *
- Efficiency: Thanks to Agentic AI, a single founder can now manage marketing, basic accounting, and customer service, tasks that previously required a team of five.
- GDP Contribution: These are not just "side hustles." In the UK and UAE, digital solo-enterprises in consulting and specialised IT now contribute a larger share to the service-sector GDP than traditional mid-sized firms.
- The "Lean" Model: These businesses have profit margins often exceeding 60-70% because their overhead is almost entirely software-based.
2.3. Top Growth Markets: India and Indonesia
By 2026, the center of gravity for SME density has moved decisively to South and Southeast Asia.
- India (63M+ MSMEs): India’s "Digital Public Infrastructure" (DPI), like the UPI payment system, has made it the world’s most efficient market for small business transactions. In 2026, Indian MSMEs contribute nearly 30% of the country’s GDP and are the primary drivers of its 6-7% annual growth.
- Indonesia: As the largest digital economy in ASEAN, Indonesia has seen a massive "Go Digital" movement. Over 65 million MSMEs exist here, with a government-led push to have 30 million of them fully onboarded onto digital ecosystems by the end of 2026.
2.4. Sector Drivers: Why Consulting, IT, and Healthcare?
These three sectors are "SME-friendly" in 2026 because they prioritise Intellectual Property over Physical Infrastructure:
- Professional Consulting: As global regulations (like the EU AI Act or Saudi Vision 2030 mandates) become more complex, SMEs are hiring "fractional" consultants rather than full-time executives.
- IT/SaaS: The "Micro-SaaS" trend, where a small team builds a tool for a specific niche (e.g., AI for dental clinics), is booming.
- Healthcare Services: With aging populations in the West and growing middle classes in the East, small-scale specialised clinics and digital health startups are seeing the highest "per-business" revenue growth in the SME segment.
2.5. Summary Table: SME Impact by the Numbers (2026)
| Metric | Global Average | High-Growth Markets (IN/ID/SA) |
| Share of Total Businesses | 90% | 95%+ |
| Share of Employment | 70% | 80%+ |
| AI Adoption Rate | 35% | 55% (Mobile-first adoption) |
| Avg. Days to Start a Business | 15 days | <24 hours (Digital-native regions) |
3. Marco Economics Integrated Top 20 Economies: 2026 Statistical Breakdown
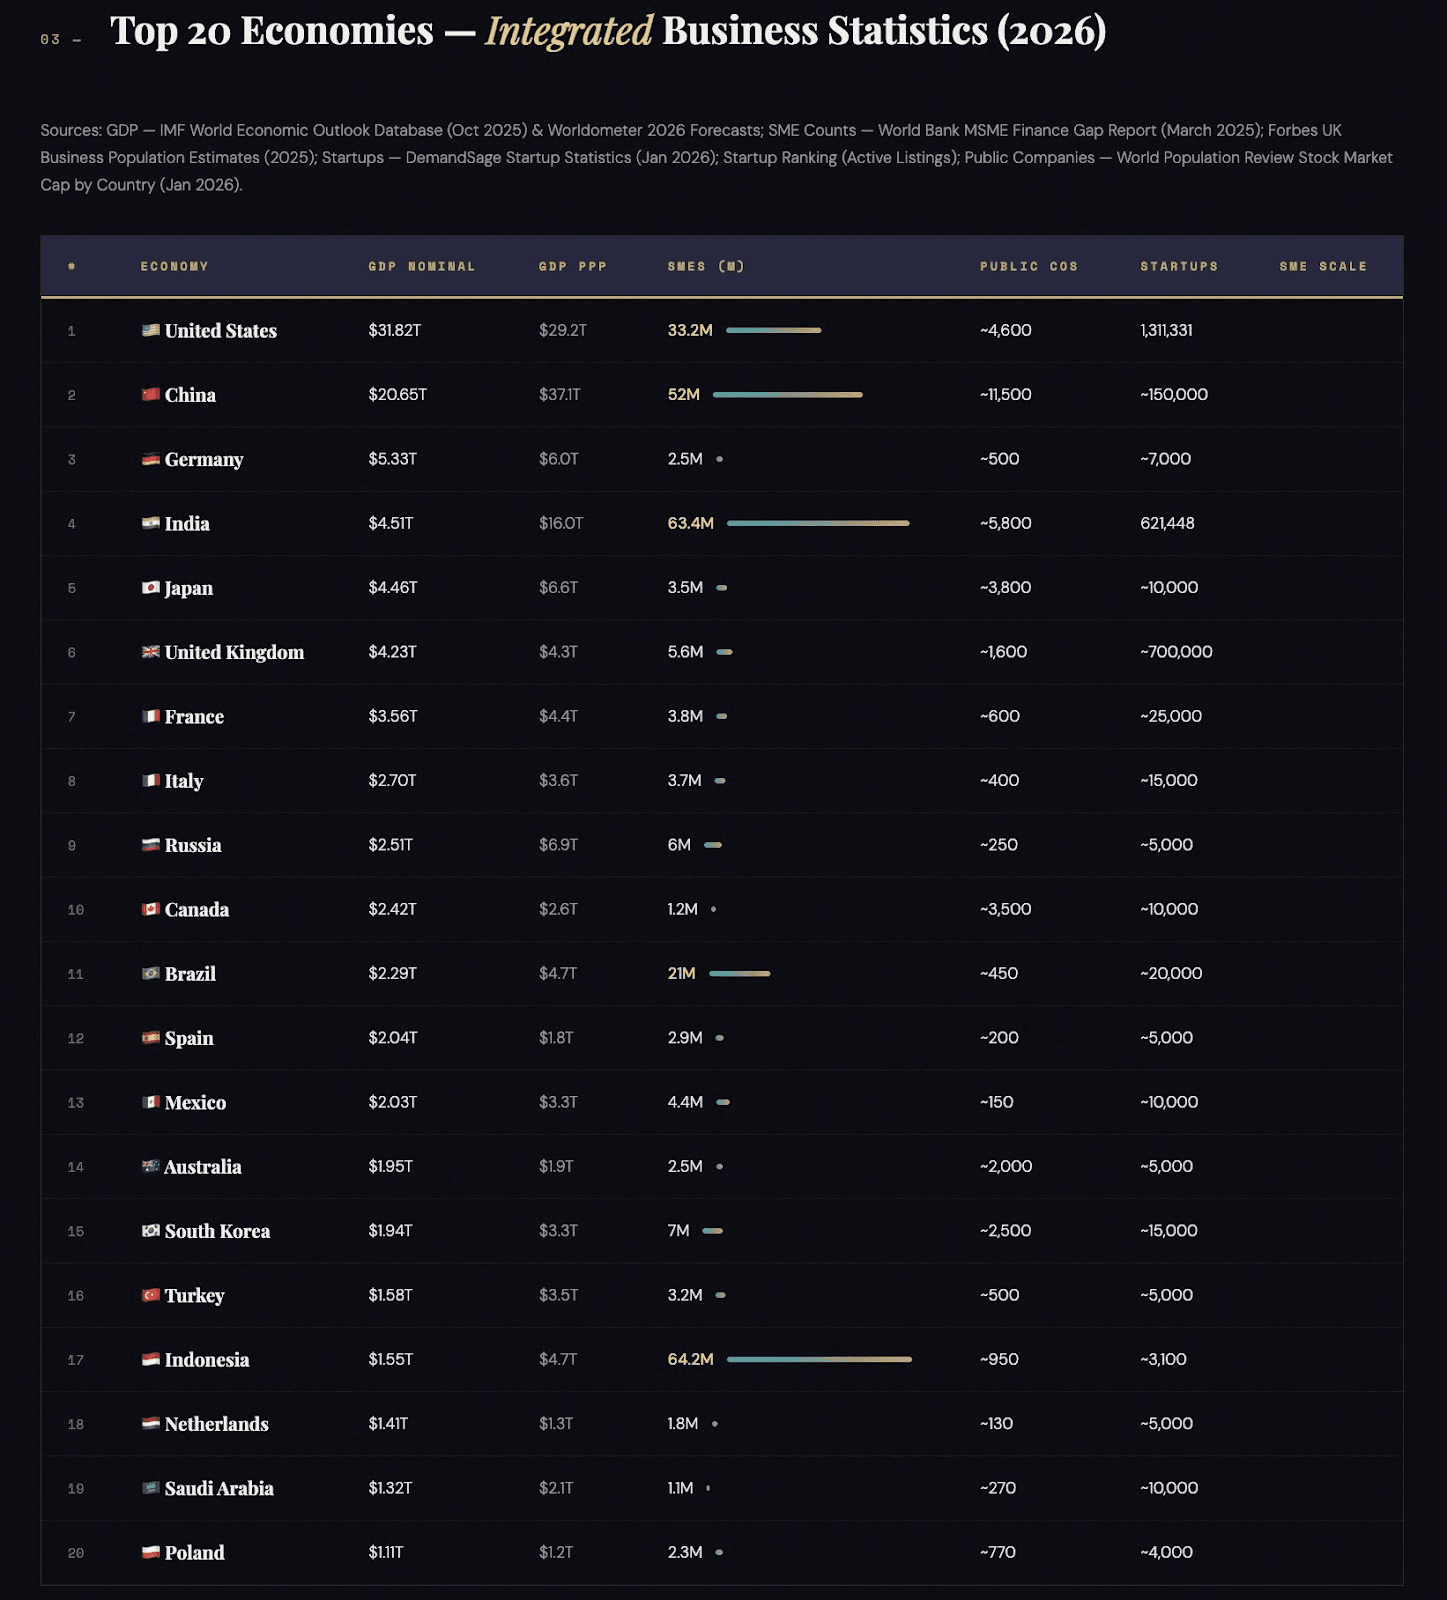
The following table integrates the Nominal GDP (current prices) and the business ecosystem counts for the Top 20 global economies as of January 2026.
| Rank | Economy | GDP (Nominal) | GDP (PPP) | SMEs (Est. Millions) | Public Companies | Startups (Est.) |
| 1 | United States | $31.82 T | $29.2 T | 33.2 | ~4,600 | 1,311,331 |
| 2 | China | $20.65 T | $37.1 T | 52.0 | ~11,500 | ~150,000 |
| 3 | Germany | $5.33 T | $6.0 T | 2.5 | ~500 | ~7,000 |
| 4 | India | $4.51 T | $16.0 T | 63.4 | ~5,800 | 621,448 |
| 5 | Japan | $4.46 T | $6.6 T | 3.5 | ~3,800 | ~10,000 |
| 6 | United Kingdom | $4.23 T | $4.3 T | 5.6 | ~1,600 | ~700,000 |
| 7 | France | $3.56 T | $4.4 T | 3.8 | ~600 | ~25,000 |
| 8 | Italy | $2.70 T | $3.6 T | 3.7 | ~400 | ~15,000 |
| 9 | Russia | $2.51 T | $6.9 T | 6.0 | ~250 | ~5,000 |
| 10 | Canada | $2.42 T | $2.6 T | 1.2 | ~3,500 | ~10,000 |
| 11 | Brazil | $2.29 T | $4.7 T | 21.0 | ~450 | ~20,000 |
| 12 | Spain | $2.04 T | $1.8 T | 2.9 | ~200 | ~5,000 |
| 13 | Mexico | $2.03 T | $3.3 T | 4.4 | ~150 | ~10,000 |
| 14 | Australia | $1.95 T | $1.9 T | 2.5 | ~2,000 | ~5,000 |
| 15 | South Korea | $1.94 T | $3.3 T | 7.0 | ~2,500 | ~15,000 |
| 16 | Turkey | $1.58 T | $3.5 T | 3.2 | ~500 | ~5,000 |
| 17 | Indonesia | $1.55 T | $4.7 T | 64.2 | ~950 | ~3,100 |
| 18 | Netherlands | $1.41 T | $1.3 T | 1.8 | ~130 | ~5,000 |
| 19 | Saudi Arabia | $1.32 T | $2.1 T | 1.1 | ~270 | ~10,000 |
| 20 | Poland | $1.11 T | $1.2 T | 2.3 | ~770 | ~4,000 |
Data Sources & Benchmarks:
- GDP & Growth: IMF World Economic Outlook Database (Oct 2025) and Worldometer 2026 Forecasts.
- SME Counts: World Bank MSME Finance Gap Report (March 2025); Forbes UK Business Population Estimates (2025).
- Startups: DemandSage Startup Statistics (Jan 2026); Startup Ranking (Active Listings).
- Public Companies: World Population Review Stock Market Cap by Country (Jan 2026).
4. AI startup ecosystem
In 2026, the global startup landscape has shifted from a "growth at all costs" model to one of resilient efficiency. While venture capital is more selective, the sheer volume of new businesses, particularly in AI and Fintech, has reached record highs due to lower barriers to entry (AI-assisted coding and operations).
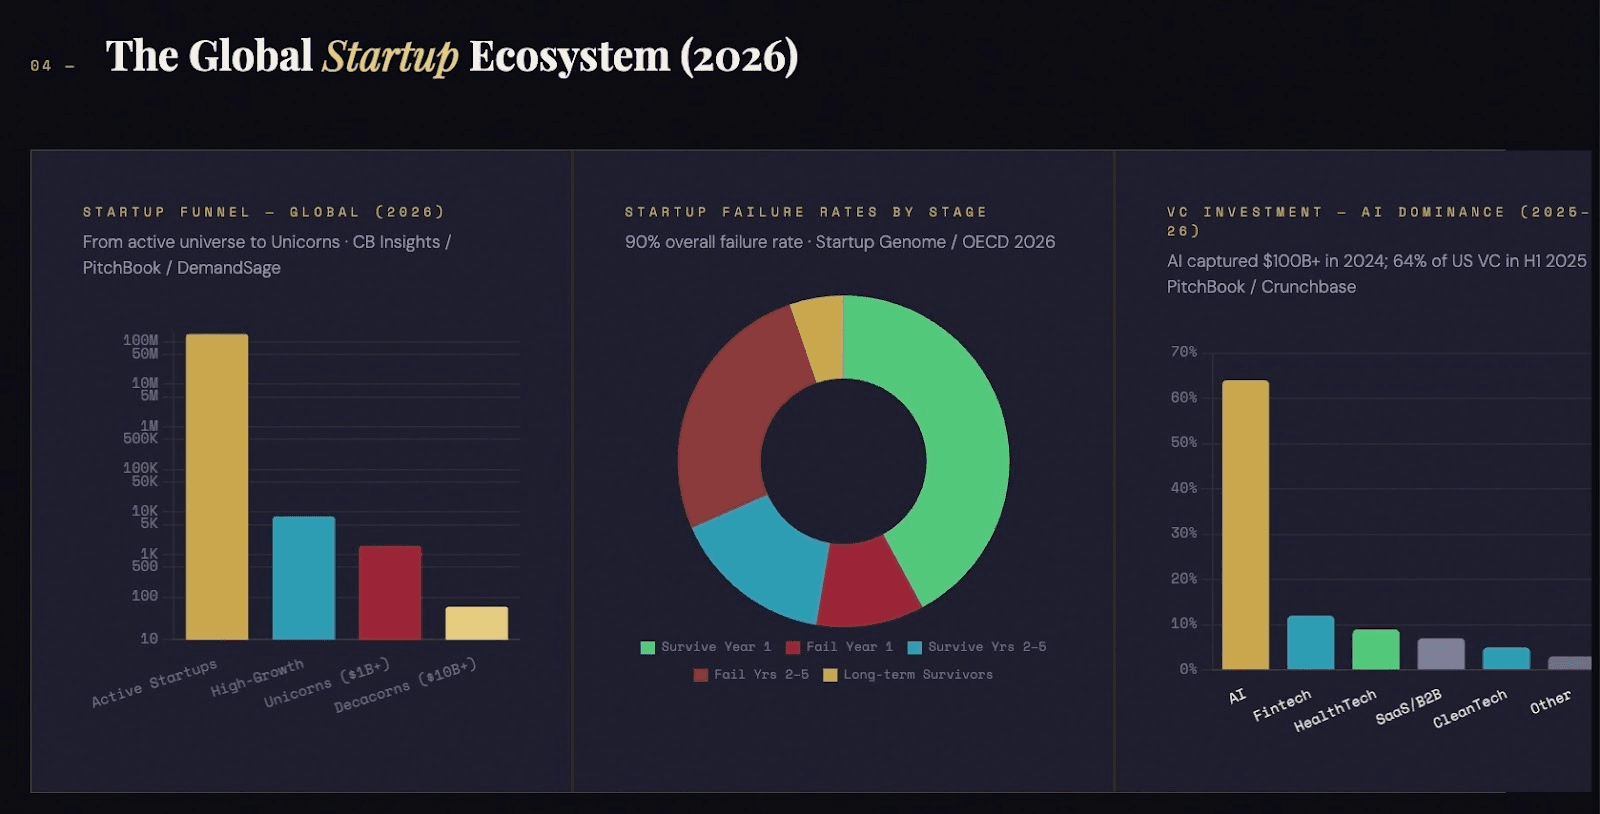
4.1. The Global Startup Funnel (2026 Macro & Micro)
| Category | Data Point (2026 Forecasts/Statistics) | Primary Sources |
| Global Startup Universe | ~150 Million+ active startups | Microsoft, StartupBlink |
| Annual New Launches | ~50 Million businesses founded yearly | DemandSage, Creatly |
| Unicorn Count | ~1,600+ private companies valued at $1B+ | CB Insights, PitchBook |
| Fintech Segment | ~34,000+ startups (growing 15% YoY) | Statista, CFTE |
| Failure Rate | 90% (20% in Year 1, 70% in Years 2–5) | Startup Genome, OECD |
Regional Breakdown: Player Counts & "Best Relationships"
The "Best Relationship" refers to the symbiotic link between a country's startup density and its specific economic drivers.
United Kingdom
- Micro Number: ~7,800 active high-growth startups; 94 Unicorns.
- Best Relationship: Fintech x Regulatory Sandbox. The UK’s "Financial Conduct Authority (FCA)" provides the world's most robust sandbox, allowing startups like Revolut and Monzo to test AI features in a live, regulated environment.
- Key Source: Beauhurst, British Business Bank.
Saudi Arabia
- Micro Number: ~1,200+ tech startups (up 236% since 2023); 8 Unicorns.
- Best Relationship: Vision 2030 x Giga-projects. Startups are directly plugged into government procurement for NEOM and Red Sea Global. Saudi Arabia is currently the fastest-growing ecosystem in the world (StartupBlink 2025/26).
- Key Source: Monsha’at (SME Authority), MAGNiTT.
Middle East & Africa (MEA)
- Micro Number: ~10,000+ active ventures across the continent; UAE and Nigeria lead.
- Best Relationship: Mobile Penetration x Financial Inclusion. In Africa (Kenya/Nigeria), the relationship is between unbanked populations and AI-micro-lending. Startups like M-KOPA and MNT-Halan are effectively the "central banks" for the informal economy.
- Key Source: Wamda, Disrupt Africa, Google/IFC Report.
Macro Relationship: Startup Density vs. GDP Growth
Research from the OECD (2026) and Startup Genome highlights a critical correlation:
- The 3% Rule: Countries where startups account for >3% of total business registrations see a 0.5% higher annual GDP growth compared to those with lower density.
- Productivity Multiplier: Startups in 2026 are adopting Agentic AI at a rate 4x faster than traditional SMEs, leading to a "Productivity Gap." Startups are now producing $1.8M in revenue per employee, while traditional SMEs lag at $240k.
- The Liquidity Bridge: 2026 is seeing a surge in "Secondary Markets" where private equity buys stakes from early employees, injecting liquidity back into local economies before a formal IPO.
Sources
- For Funding Data: MAGNiTT (MENA-focused) and Crunchbase (Global).
- For Ecosystem Rankings: StartupBlink (The most comprehensive 2026 Index).
- For Policy & Macro Trends: OECD SME & Entrepreneurship Outlook.
The 2026 AI startup ecosystem is experiencing massive growth, with over 10,000 AI-focused startups globally and AI-related companies securing nearly one-third of total venture funding. Dominated by Silicon Valley, the landscape is shifting from core model training to vertical AI applications, driven by high demand for productivity, with 64% of U.S. VC investment in H1 2025 focused on AI.
4.2. Key components of the 2026 AI startup ecosystem include:
- Global Leaders: Silicon Valley leads, hosting 22% of all AI-native startups, followed by New York and London. Other prominent hubs include Tel Aviv, Boston, and China.
- Investment Surge: AI is the dominant tech sector, attracting over $100 billion in investment in 2024.
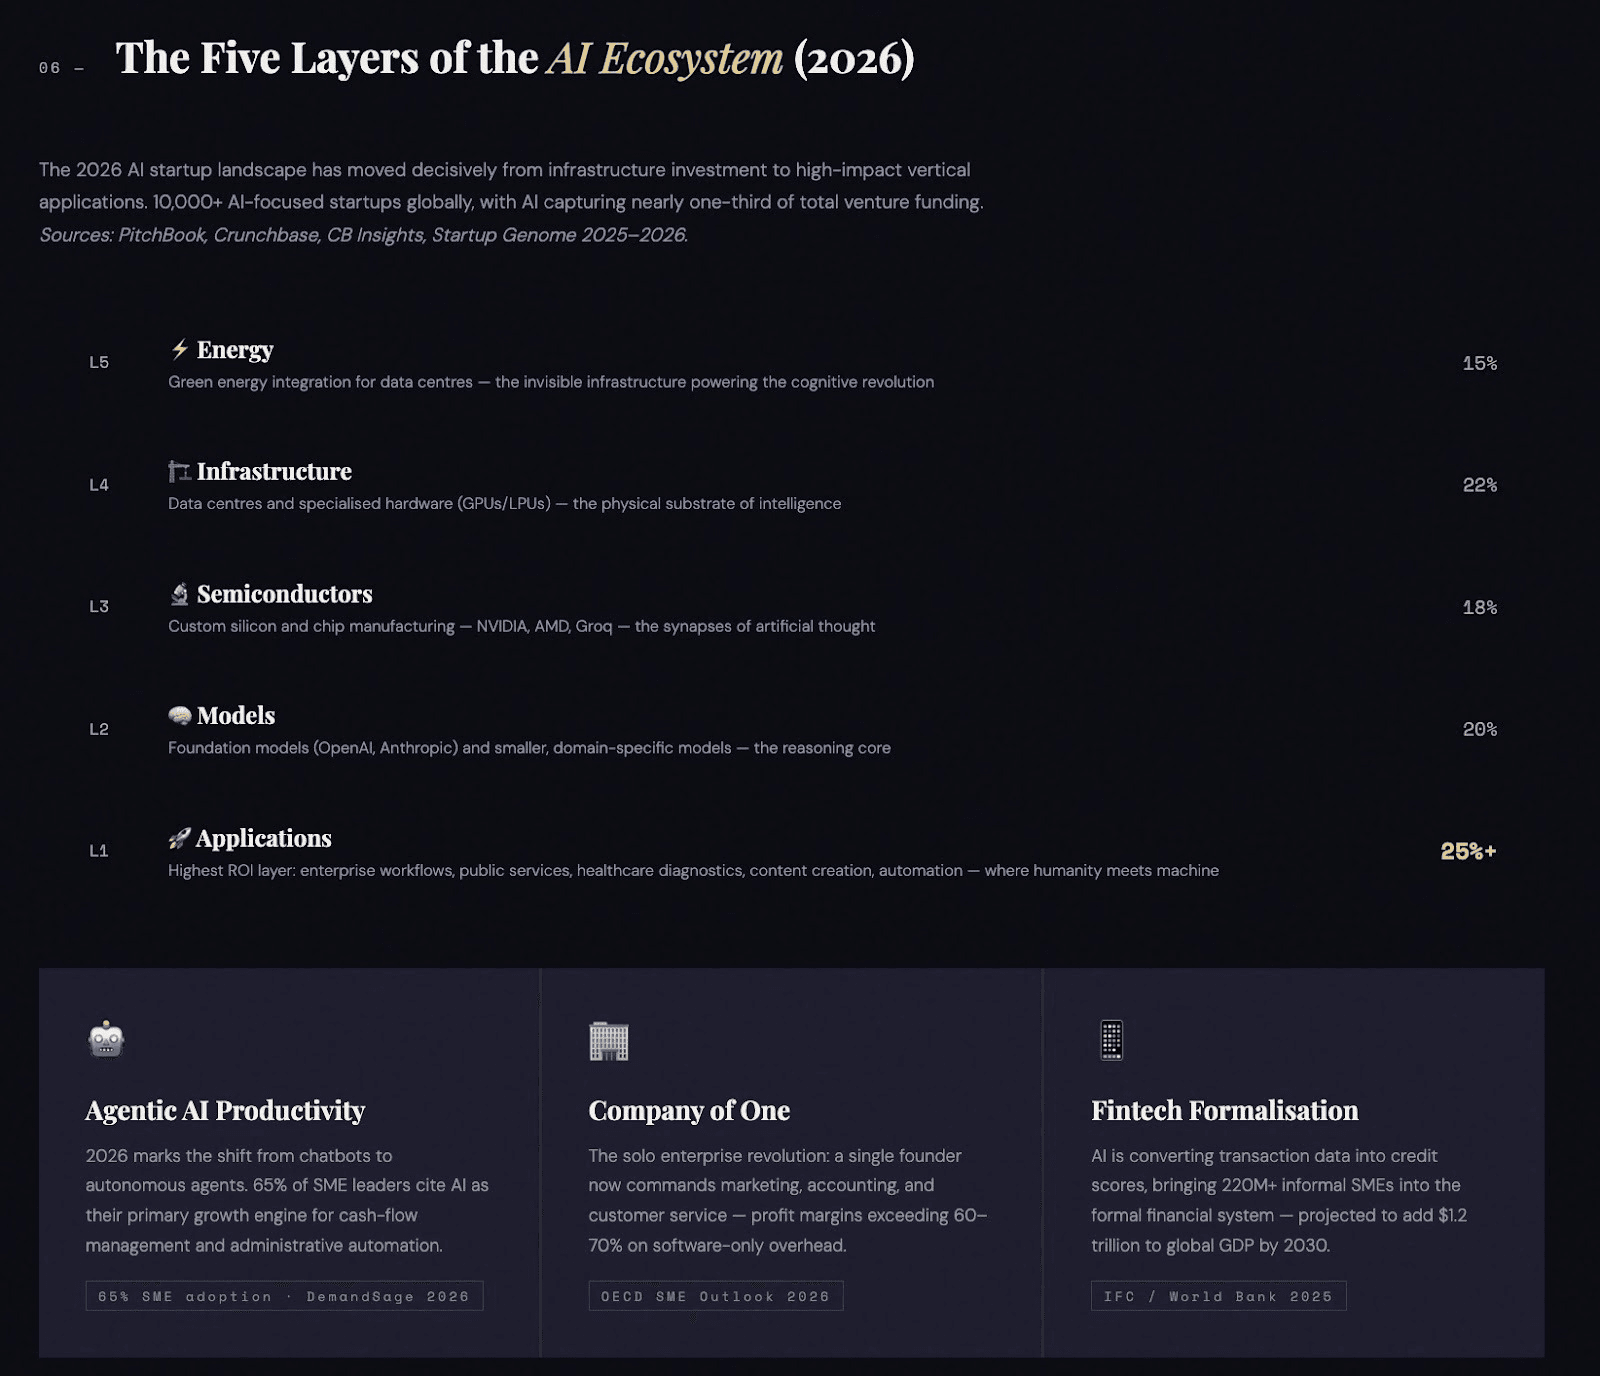
4.3. The 5 Layers of AI Ecosystem:
- Application Layer: Startups solving industry-specific problems (e.g., healthcare diagnostics,, content creation, automation).
- Models Layer: Foundation model development, such as OpenAI and Anthropic.
- Semiconductor Layer: Hardware providers like NVIDIA, AMD, and Intel.
- Infrastructure Layer: Data centers and cloud platforms.
- Energy Layer: Powering the necessary data centers.
- Shift in Focus: The market is transitioning from purely generative AI to specialised, domain-specific, and, in some cases, smaller, more efficient AI models.
- Challenges: High competition, the need for specialised talent, and the imperative for startups to demonstrate clear profitability and scalability beyond simply using large language models.
The AI startup ecosystem is currently defined by a "cognitive revolution" characterised by a shift from broad infrastructure investment to high-impact applications and "AI-native" business models.
4.4. Global Landscape & Key Hubs
As of 2025–2026, the ecosystem is moving toward a hub-and-network structure where regional innovation systems depend on global linkages and cross-sectoral collaboration.
- San Francisco: Remains the undisputed global capital, attracting more AI funding than all European ecosystems combined.
- London: Ranks #3 globally and remains Europe's leading AI hub, supported by a strong academic base and players like Google DeepMind.
- Beijing: The most AI-intensive ecosystem; for every $3 invested in new startups, $2 goes to AI.
- Bengaluru: Emerging as a global powerhouse with a tech talent pool exceeding one million professionals and high AI adaptability.
- European Union: Actively fostering "AI Factories" across members like Germany, Spain, and Finland to provide supercomputing access for startups.
4.5. The 5 Layers of the AI Ecosystem
A comprehensive AI ecosystem is structured across five critical layers:
- Energy: Green energy integration for data centers.
- Infrastructure: Data centers and specialised hardware (GPUs/LPUs).
- Semiconductors: Custom silicon and chip manufacturing (e.g., NVIDIA, AMD, Groq).
- Models: Foundation models (OpenAI, Anthropic) and smaller, domain-specific models.
- Applications: The layer with the highest ROI, focusing on enterprise workflows and public services.
4.6. Startups & Unicorns (2026 Trends)
A "Startup" is defined by its intent for high-velocity growth. In 2026, the failure rate remains high (~90%), but the volume of creation is at an all-time high due to lower AI-driven entry costs.
- Total Active Startups: ~150 Million.
- The "Unicorn" Tier: As of Jan 2026, there are over 1,600 private companies valued at $1B+.
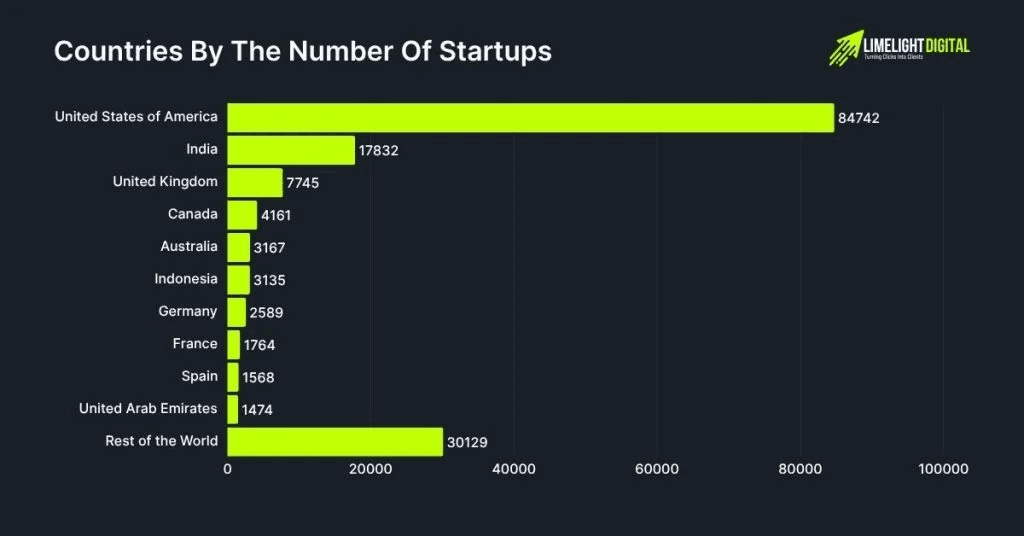
- Regional Leader: The United States remains the global hub with 1.31 million startups, followed by India at ~621,000.
4.7. Startup Emerging Trends & Challenges
- AI-Native Startups: A new breed of companies where AI is the core product and competitive advantage, rather than just a feature.
- Lower Entry Barriers: Tools are increasingly democratised, allowing founders to build breakthrough solutions with fewer initial resources through "vibe coding" and AI-assisted development.
- Funding Shifts: Investors are prioritising revenue-generating companies over pure research; some now expect $1M in revenue within the first six months.
- The "10/20/70" Rule: Successful adoption requires devoting 10% of resources to algorithms, 20% to technology/data, and 70% to people and processes.
5. Conclusion: SMEs Measuring Economic Resilience
This concluding report synthesis frames the shift from "Volume" to "Velocity" in SME economics. By 2026, the global consensus has moved away from measuring purely by Nominal GDP to a more nuanced "Resilience Metric"—the density and digital health of the SME layer.
SMEs are no longer just a "sector" of the economy; they are its structural foundation. As we have seen through our collaboration, the traditional economic powerhouses (US, Germany) and the emerging high-growth giants (India, Indonesia, Saudi Arabia) represent two different but equally critical models of resilience.
Decentralised Resilience vs. Efficient Centralisation
The disparity between Nominal GDP and SME count reveals a fundamental truth about national stability:
- Decentralised Models (India/Indonesia): With over 63 million MSMEs in India and 65 million in Indonesia, these economies are highly decentralised. A shock to a single industry or large corporation does not collapse the system because the "economic cells" are numerous and independent. This SME Density creates a "cushion" against global volatility.
- Efficient Centralisation (US/Germany): In these markets, the narrative is one of Input-Output Efficiency. A smaller number of highly capitalised, technically advanced SMEs drive massive value. While they produce more "GDP per firm," they are often more susceptible to systemic shocks in credit markets or supply chain bottlenecks.
The Digital "Formalisation" Frontier
In the Middle East and Africa, we are witnessing the Formalisation of the Informal. AI is the bridge. By turning transaction data into credit scores, fintechs are bringing the "Invisible 220 million" informal SMEs into the light of the global financial system. This transition is expected to add an estimated $1.2 trillion to global GDP by 2030.
The SME Finance Gap: A $5.7 Trillion Opportunity
Despite their importance, the SME Finance Gap remains the greatest blocker to this resilience. In 2026, the gap has expanded to a projected $5.7 trillion for formal SMEs, and nearly $8 trillion when including informal ventures.
Why focusing on the Top 20 Economies is the Next Logical Step:
The "Top 20" economies (G20) hold the keys to systemic change. However, even within this elite group, the "underserved" vary wildly:
- In Saudi Arabia: The gap is being bridged by government-led "Giga-project" procurement.
- In the UK: The gap is widening for "Micro-SMEs" as traditional banks tighten criteria due to 2026 interest rate volatility.
- In Brazil and Mexico: High interest rates are making the "Financing Gap" a “Cost-of-Capital Gap.”