
business resources
Yield Curve: A Warning Sign for the Global Economy?
11 Dec 2025

As of November 2025, the U.S. Treasury yield curve has normalized, showing a positive spread of 51 basis points, with the 10-year Treasury standing at 4.12% and the 2-year at 3.60%.
This marks the end of a historic yield curve inversion, lasting for 793 days and being the longest since the 80s.
In the chart below, the 2-year Treasury yield is subtracted from the 10-year yield, with the section representing the curve inversion highlighted.
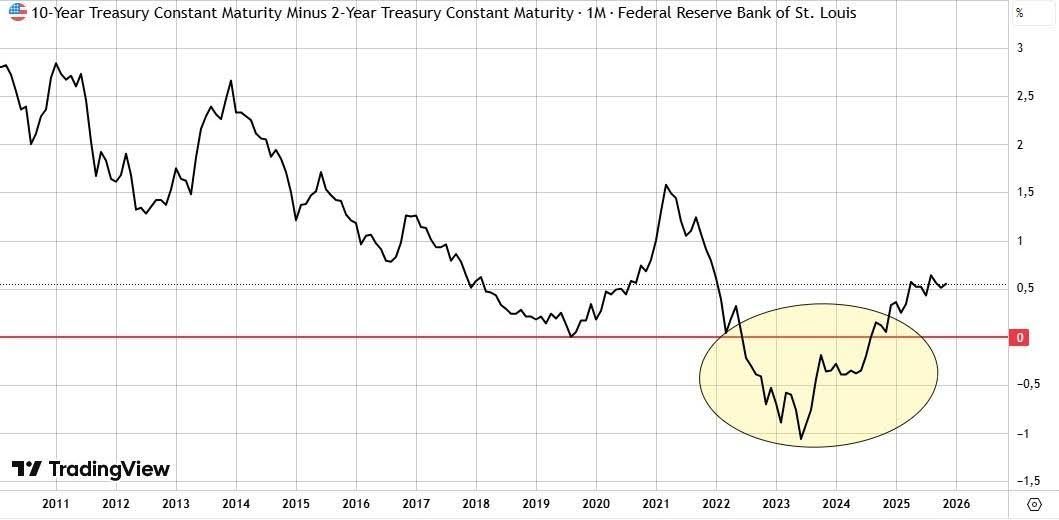
The yield curve inversion is widely regarded as a leading indicator of a potential recession. Short-term yields exceed long-term yields, reflecting investors' concerns about the future and the greater risk associated with short-term investments.
The markets believe that rates are high enough to negatively impact the economy, which may lead to future interest rate cuts by the Fed. Therefore, investors take refuge in long-term Treasuries, driving up their price and lowering their yield.
Yield curve steepening is the opposite process — the curve "normalizes," regaining its positive slope and widening the spread between short-term and long-term yields.
There are two types of yield curve steepening:
- BULL STEEPENING: Usually occurs during a recession, when 2-year yields fall faster than 10-year yields. This often happens when the Fed keeps rates anchored at 0% and stimulates the economy through QE or other liquidity injections. Historical reference periods include: 1990-1992, 2001, 2003, 2008, and 2020.
Example: 2-year yields drop from 5.00% to 3.00%, while 10-year yields drop from 4.50% to 4.00%. As a result, the spread moves from -0.50% to +1.00%.
- BEAR STEEPENING: Occurs when 10-year yields grow faster than 2-year yields, representing a bear market for long-term bonds. Bear steepening periods include: 1984, 1987, 1996, 1999, 2010, 2013, 2016, and 2021.
Example: 2-year yields remain at 4.00%, while 10-year yields rise from 4.00% to 5.00%. In this case, the spread would move from 0% to +1.00%.
The final result is the same — the curve normalizes with the same spread, but the implications for investors are different.
In the case of bull steepening, the Fed aggressively cuts rates following an economic slowdown, causing short-term rates to collapse faster than long-term rates — a strong signal of a potential recession.
Conversely, in the case of bear steepening, long-term yields rise more rapidly than the short-term ones. Investors fear persistent long-term inflation, and growing government deficits require greater long-term debt issuance.
For the first time in history, markets are experiencing a hybrid dynamic. The Fed's rate cuts have caused short-term yields to collapse, which is a bull steepening configuration. In contrast, between September and November 2025, long-term yields rose faster, a classic bear steepening pattern.
Several factors contributed to this configuration:
- The U.S. deficit reached $1.8 trillion in 2024, becoming the third-largest in history and growing by 8.1% year-over-year.
- Inflation has fallen from 9.1% in mid-2022 to 2.5% in mid-2025, but remains above the Fed's 2% target;
- The Fed is constrained from cutting rates too quickly due to persistent inflation.
This is the first documented case of bear steepening after such a prolonged inversion, reflecting markets' lack of confidence in the Fed's ability to control inflation.
If a recession emerges, the Fed may have limited room to reduce rates further, raising the risks of sharp price declines and potential stagflation.
Whether the economy experiences a soft or hard landing will depend on economic data in the coming months and whether corporate earnings can keep pace.
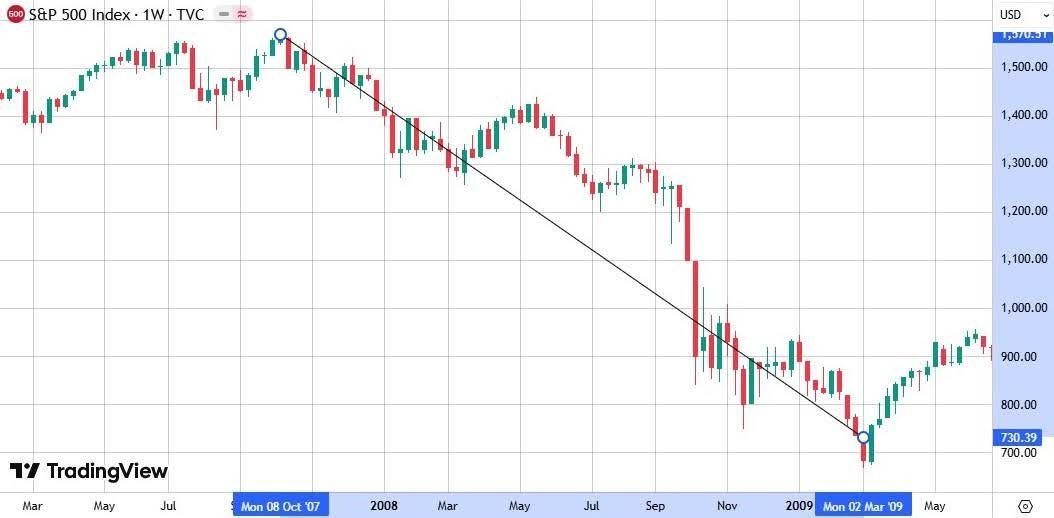
In December 2007, when the recession officially began, analysts’ consensus predicted a 2.5% GDP growth for the following year. At that time, the S&P 500 was at 1,500, only 5% below its peak; the Fed had just begun cutting interest rates (4.25%); and the yield curve had normalized with a +50 bps spread. Just 12 months later, the S&P 500 fell nearly 47% to 800, as shown on the SPX chart.
The current situation represents a crossroads in global financial markets. Investors should exercise extreme caution regarding where to invest and be prepared to react promptly to possible changes in economic scenarios and policy choices that could have consequences for the months ahead.


